Office Space Demand Forecast, Fourth Quarter 2024
Release Date: December 2024
Demand for Office Space Expected to Stabilize Before Resuming Growth

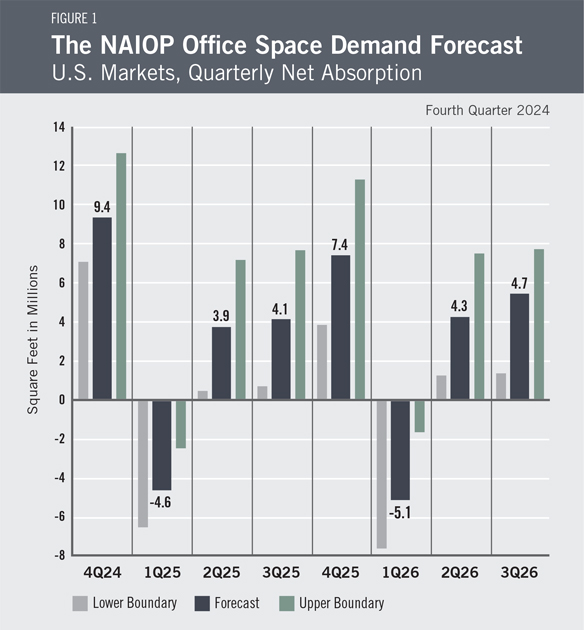
After five straight quarters of negative net absorption, the U.S. office market turned a corner with 1.0 million square feet of positive net absorption in the second quarter of 2024 and 4.9 million in the third quarter, according to historical data provided by CoStar. The risk of a recession appears to have diminished, and it is possible that the recent positive absorption is the result of a structural improvement in demand that will persist over the next two years. Given these trends, net office space absorption in the fourth quarter of 2024 is expected to be 9.4 million square feet, with another 10.8 million square feet of positive absorption for the full year in 2025 and 3.9 million square feet of positive absorption in the first three quarters of 2026. However, uncertainty about the effects of future federal policy on the economy and government leasing activity presents a potential risk to continued demand growth. If the construction of new office space continues to outpace demand in 2025, the average vacancy rate will continue to rise.
New Data Source for Office Space Demand ForecastsThe Office Space Demand Forecasts now refer to historical net absorption and other historical market data provided by CoStar. Past editions of the Office Space Demand Forecasts utilized and tracked historical data provided by CBRE Econometric Advisors. Due to the change in data sources, the current forecast is not directly comparable to past forecasts. Comparisons between forecast absorption and actual absorption will resume in 2025. For more information about the data used in this forecast, please refer to the Key Inputs and Disclaimers section at the end of the report. |
The Office Market
The office market has recently benefited from the sustained outperformance of the macroeconomy and jobs market, and some prominent firms have indicated they are requiring that their workers spend more time in the office than in prior years. However, most metrics of daily office utilization have appeared to be generally stable year over year, with little to suggest a major shift in actual work patterns thus far. With many pre-pandemic leases yet to reach renewal, it remains unclear if there has been a durable increase in occupiers appetite for space. Recent data should be seen as an encouraging sign that demand for office space has begun to stabilize, but anemic demand growth has yet to catch up with new construction. According to CoStar, 17.0 million square feet of net new space was delivered in the second and third quarters of 2024, resulting in a small increase in the average vacancy rate from 11.7% to 11.8%. The pace of new deliveries has slowed from 27.1 million square feet delivered over the second and third quarters of 2023.
The economic and fiscal policies of the next presidential administration and Congress may have a dynamic yet unpredictable effect on the office market. Early indications from equity markets suggest higher levels of business optimism that may translate to higher demand for office space. Conversely, higher medium- and long-term interest rates could place a damper on occupiers ability to expand and make capital investments. Higher rates may be further supported by an extension or expansion of the Tax Cuts and Jobs Act if tax cuts are not offset by similar spending reductions to limit the growth of the federal deficit. A potential requirement that federal workers increase their office attendance could boost utilization rates, but a resulting increase in demand may be offset by budget cuts in some federal agencies. Thus, it is too early to say what the ultimate impact of the election will be on office markets or the broader real estate industry. Given the current level of uncertainty, it is possible that firms will remain cautious for the next several months until fiscal policy becomes clearer.
Economic Factors
Year-over-year inflation, as measured by the Consumer Price Index, has cooled to 2.6%,1 approaching the Federal Reserve s target of 2%. Most market participants believe inflation has been tamed, and this has allowed the Federal Reserve to lower the target range for the federal funds rate by 75 basis points since September. GDP growth has remained steady and strong with 2.8% annualized growth in the third quarter,2 and the economy appears to be experiencing a much-discussed "soft landing" heading into 2025. The yield curve on U.S. Treasuries has flattened as short-term rates have fallen and long-term rates have risen, suggesting that bond markets have grown somewhat more optimistic about the economy.
Other indicators provide a mixed outlook on future economic growth. The economy currently appears strong, but a recession in 2025 cannot be ruled out. The Conference Board s Leading Economic Index declined in October due to falling manufacturing demand.3 However, the board s Coincident Economic Index increased over the past six months,4 marking the longest sustained divergence between the two measures in history. It is too early to make any definitive statements about how policy under the next presidential administration and Congress will affect the economy, but it is worth noting that bond markets are currently pricing higher government spending and inflationary risk into long-term bond yields. Higher interest rates could present unique challenges to real estate capital markets if they remain elevated.
The Forecast Model

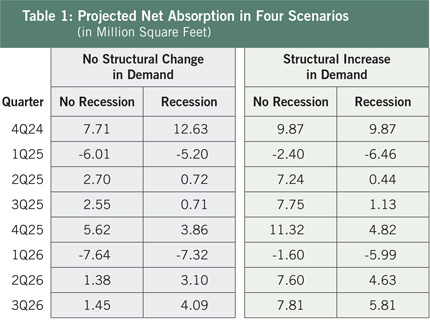
The model that informs this forecast draws from historical data on the economy and office real estate absorption to project future demand. Positive absorption over the last two quarters suggests the possibility of a structural improvement in demand for office space due to employers requiring more frequent office attendance within their firms, a decline in sublease availability, and an increase in lease renewals as occupiers struggle to find attractive new space to lease. The possibility that the federal government may require more frequent office attendance could also contribute to a structural increase in demand for office space. However, the authors believe it is equally possible that recent positive absorption is not indicative of a structural improvement in demand and that leasing activity will revert to a more gradual recovery. While a recession appears less likely than a year ago, it still cannot be ruled out. Table 1 provides the range of expected absorption under four scenarios: with or without a structural increase in demand and with or without a recession. The current forecast assumes a 50% chance of a structural rise in demand and a 25% chance of a recession in 2025. Each scenario is weighted accordingly, and the resulting forecast is illustrated in Figure 1.
Key Inputs and Disclaimers
In January 2016, the NAIOP Research Foundation published Forecasting Office Space Demand, a model that forecasts net absorption of U.S. office space on a quarterly basis for eight consecutive quarters. Created by researchers Hany Guirguis, Ph.D., of Manhattan College, and Joshua Harris, Ph.D., CRE, CAIA, of Fordham University, the model is similar to that used for the NAIOP Industrial Space Demand Forecast, which successfully projected a drop and rebound in net absorption of industrial space in 2009 and 2010. (The industrial space demand model was created by Guirguis along with Randy Anderson, Ph.D., then at the University of Central Florida.) Below are the leading, coincident and lagging variables used in the office space demand forecast.
- The growth rate in real gross domestic product (GDP) captures the broadest level of macroeconomic activity, reflecting the value of all goods and services produced each year.
- Corporate profits of domestic industries directly capture the financial capacity and growth of firms that may need to expand. Profits are a source of retained earnings, so they provide a clue about how much money is available to fund investments in plants and equipment, an investment activity that raises productive capacity.
- Total employment in the financial services sector is a direct measure and proxy for office-using employment that best fits with changes in office space demand.
- Two variables from the Institute for Supply Management's Non-Manufacturing Indices serve as proxies for a sentiment measure on the future health of office-using firms. The ISM-NM Inventories Index measures increases and decreases in inventory levels, while the ISM-NM Supplier Deliveries Index measures how long it takes suppliers to deliver parts and materials that are integral to service-sector businesses.
- Core Personal Consumption Expenditures Price Index Inflation Rate (PCE Inflation).
These five measures make possible an accurate two-year forecast of net absorption of office space nationwide. The methods used in the forecast are dynamic rather than static to account for the changing nature of the underlying macroeconomy. Historical office real estate market data are provided by CoStar, which assumes no responsibility for this forecast. The dataset used for the forecast includes all office properties in the 390 largest U.S. markets tracked by CoStar, regardless of property size or owner occupancy status. Net absorption and other real estate market data identified in this report may vary when compared with other datasets.
Authors
Hany Guirguis, Ph.D., Professor, Economics and Finance, Manhattan College
Joshua Harris, Ph.D., CRE, CAIA, Executive Director, Fordham Real Estate Institute, Fordham University
Media Inquiries
Please contact Kathryn Hamilton, CAE, vice president for marketing and communications, at hamilton@naiop.org.
1 U.S. Bureau of Labor Statistics, Consumer Price Index Summary, news release, November 13, 2024, https://www.bls.gov/news.release/cpi.nr0.htm.
2 Bureau of Economic Analysis, Gross Domestic Product, Third Quarter 2024 (Second Estimate) and Corporate Profits (Preliminary), news release, November 27, 2024, https://www.bea.gov/news/2024/gross-domestic-product-third-quarter-2024-second-estimate-and-corporate-profits.
3 The Conference Board, The Conference Board Leading Economic Index (LEI) for the US Fell in October, news release, November 21, https://www.conference-board.org/topics/us-leading-indicators/press/us-lei-nov-2024.
4 Ibid.
* Research reports are complimentary to all audiences. Webinars are free for members and paid for nonmembers.

