


Office Space Demand Forecast, Second Quarter 2024
Release Date: June 2024
Demand for Office Space Expected to Shrink Through Early 2025
The office market performed worse in the first quarter of 2024 than previously forecast, with national office net absorption totaling a negative 13.4 million square feet.1 Office utilization has remained relatively flat since the beginning of the year as evidenced by building-access records.2 A reversal in optimism about the economy in late 2023 may have led firms to pause or scale back expansion plans. Elevated interest rates are constraining corporate earnings and firms’ ability to expand their operations, which appears likely to continue, at least in the near term. Given these trends and the possibility of a recession in 2024, net office space absorption over the last three quarters of 2024 is expected to be negative 11.8 million square feet. Moving forward, the forecast projects that net absorption will increase slightly in 2025 and will total approximately negative 4.5 million square feet.
The longer that firms face slow economic growth, elevated inflation and high interest rates, the more likely they are to seek cost reductions and operational efficiencies. Unfortunately for the office space market, this frequently translates to curtailing office real estate expenses when possible. Although a structural shift in the use of space due to remote work (i.e., less office space leased per employee) has occurred, much of this change is already reflected in current market conditions. Occupiers have had several quarters to adapt to new work patterns, and macroeconomic and general business conditions will likely play a larger role in shaping their leasing decisions in the coming quarters. Once the economy returns to a trend of sustained growth and lower inflation, office demand should increase as firms need to lease space to grow their operations. Although such a scenario once seemed likely to occur in 2024, it is now unlikely to materialize until 2025 at the earliest.
Economic Factors
Inflation remains a persistent factor in the U.S. economy and remains above or near 3% in recent readings of inflation, including the Consumer Price Index (CPI) and the Personal Consumption Expenditures (PCE) Price Index.3 This has lifted forecasts for the Fed’s benchmark overnight rate as interest rate cuts may not come until early 2025. Additionally, first quarter gross domestic product (GDP) only rose by 1.6% (annualized),4 potentially signaling that growth will slow further in coming quarters. For these reasons, the forecast assumes that future economic growth will be slower than previously predicted and that the possibility of a recession by the end of 2024 or in 2025 has increased.
Inflation continues to impact consumers as higher prices and higher interest rates constrain their ability to spend and dampen their outlook on the economy. The Consumer Confidence Index has now fallen for three consecutive months from February to April of this year.5 This is despite still low unemployment of 3.9%, though monthly hirings did slow in April to just 175,000.6 With economic growth apparently subsiding, employment growth may slow further. Reflecting these trends, the forecast now assumes that business activity and investment will grow more slowly for the remainder of 2024 and thus negatively impact demand for office space.
The Forecast Model
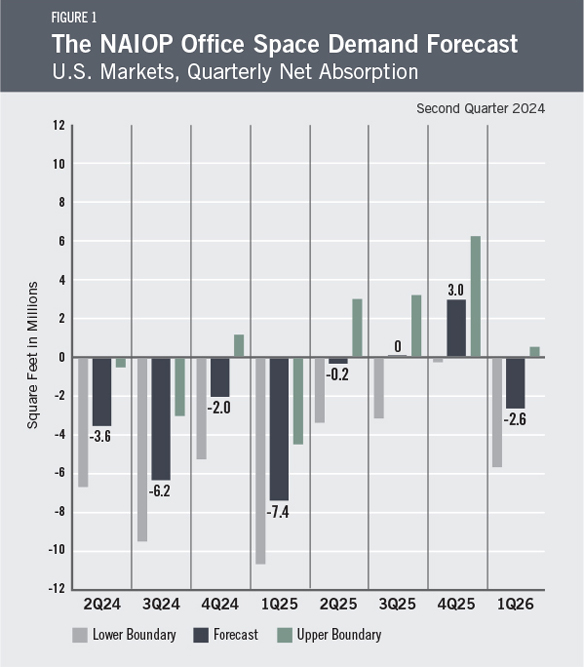
The model that informs this forecast draws from historical data on the economy and office real estate absorption to project future demand. Recent trends in office absorption suggest office sector performance will reflect economic conditions, as in past economic cycles, though the amount of office space occupied per worker is lower than it was before 2020. The baseline out-of-sample forecast is illustrated in Figure 1. The current forecast assumes there is a 60% chance that economic growth slows and then dips into a recession in the third quarter of 2024. If a recession does occur, actual net absorption is expected to be more sharply negative. If a recession does not occur, absorption will be higher than the current forecast.
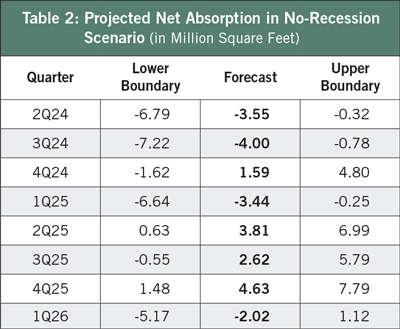
Table 1 provides the expected range in net absorption if the economy slows and enters a recession in the third quarter of 2024. Figure 1 assigns these values a 60% weighting. Table 2 assumes that the economy does not enter a recession.
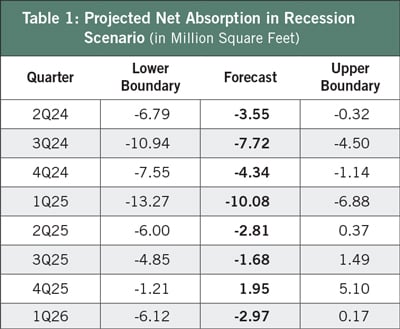
An analysis of the inverted yield curve and Conference Board Leading Economic Indicators suggests that a recession may occur during the second half of 2024 (reflected in Table 1). In that scenario, net absorption in the next four quarters from the second quarter of 2024 to the first quarter of 2025 would total approximately negative 25 million square feet. However, net absorption would then flatten out over the remaining four quarters to total negative 5.5 million square feet.
If no recession occurs, the forecast projects that net absorption would still be negative over the next four quarters, but that the office market would shed only 9.4 million square feet between the second quarter of 2024 and the first quarter of 2025. The market would then experience a modest rebound in demand that largely reverses these losses, with 9 million square feet absorbed between the second quarter of 2025 and the first quarter of 2026.
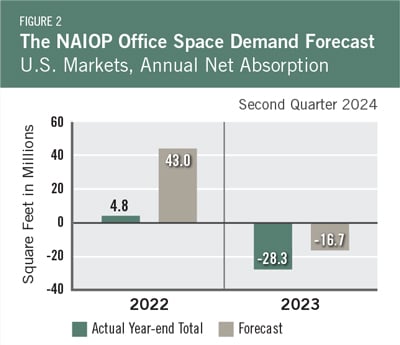
Actual Versus ForecastFigure 2 compares the forecast to actual net absorption. The forecast value tallies the most recent forecast data for each quarter of the year. The forecast for 2023 was negative 16.7 million square feet, which was 11.6 million square feet more than the negative 28.3 million square feet that were absorbed for the year. The forecast for 2022 was 43 million square feet, which was 38.2 million square feet more than the 4.8 million square feet that were absorbed for the year. |
 |
Key Inputs and Disclaimers
In January 2016, the NAIOP Research Foundation published “Forecasting Office Space Demand,” a model that forecasts net absorption of U.S. office space on a quarterly basis for eight consecutive quarters. Created by researchers Hany Guirguis, Ph.D., of Manhattan College, and Joshua Harris, Ph.D., CRE, CAIA, of Fordham University, the model is similar to that used for the NAIOP Industrial Space Demand Forecast, which successfully projected a drop and rebound in net absorption of industrial space in 2009 and 2010. (The industrial space demand model was created by Guirguis along with Randy Anderson, Ph.D., then at the University of Central Florida.) Below are the leading, coincident and lagging variables used in the office space demand forecast.
- The growth rate in real gross domestic product (GDP) captures the broadest level of macroeconomic activity, reflecting the value of all goods and services produced each year.
- Corporate profits of domestic industries directly capture the financial capacity and growth of firms that may need to expand. Profits are a source of retained earnings, so they provide a clue about how much money is available to fund investments in plants and equipment, an investment activity that raises productive capacity.
- Total employment in the financial services sector is a direct measure and proxy for office-using employment that best fits with changes in office space demand.
- Two variables from the Institute for Supply Management’s Non-Manufacturing Indices serve as proxies for a sentiment measure on the future health of office-using firms. The ISM-NM Inventories Index measures increases and decreases in inventory levels, while the ISM-NM Supplier Deliveries Index measures how long it takes suppliers to deliver parts and materials that are integral to service-sector businesses.
- Core Personal Consumption Expenditures Price Index Inflation Rate (PCE Inflation).
These five measures make possible an accurate two-year forecast of net absorption of office space nationwide. The methods used in the forecast are dynamic rather than static, to account for the changing nature of the underlying macro economy.
Office absorption data are provided by CBRE Econometric Advisors, which assumes no responsibility for this forecast. The absorption forecast tracks with CBRE office data and may vary when compared to other datasets. Data include office buildings in the U.S. with a minimum rentable building area that ranges from 10,000 to 150,000 square feet, depending on the market. The current forecast is based on first-quarter 2024 data.
Authors
Hany Guirguis, Ph.D., Professor, Economics and Finance, Manhattan College
Joshua Harris, Ph.D., CRE, CAIA, Executive Director, Fordham Real Estate Institute, Fordham University
Media Inquiries
Please contact Kathryn Hamilton, CAE, vice president for marketing and communications, at hamilton@naiop.org.
1 Data from CBRE EA.
2 Kastle Systems, “Kastle Back to Work Barometer,” May 13, 2024, https://www.kastle.com/safety-wellness/getting-america-back-to-work/.
3 U.S. Bureau of Labor Statistics, “Consumer Price Index Summary,” news release, May 15, 2024, https://www.bls.gov/news.release/cpi.toc.htm; Bureau of Economic Analysis, “Personal Income and Outlays, March 2024,” news release, April 24, 2024, https://www.bea.gov/news/2024/personal-income-and-outlays-march-2024.
4 Bureau of Economic Analysis, “Gross Domestic Product, First Quarter 2024 (Advance Estimate),” news release, April 25, 2024,
https://www.bea.gov/news/2024/gross-domestic-product-first-quarter-2024-advance-estimate.
5 The Conference Board, “US Consumer Confidence Retreats in April,” news release, April 30, 2024, https://www.conference-board.org/topics/consumer-confidence.
6 U.S. Bureau of Labor Statistics, “Employment Situation Summary,” news release, May 3, 2024, https://www.bls.gov/news.release/empsit.nr0.htm.
* Research reports are complimentary to all audiences. Webinars are free for members and paid for nonmembers.
