NAIOP Market Monitor 2024
Release Date: July 2024
Executive Summary
The NAIOP Market Monitor provides insights into shifting market conditions and capital flows across the United States. The report’s findings can help investors and developers identify regional trends and markets that align with their risk and return objectives or warrant further examination. The 2024 NAIOP Market Monitor indicates a continuation of several post-pandemic trends in office and industrial real estate markets. Notable findings include:
- Office markets with commuter-reliant central business districts (CBDs) are still struggling to find their footing as they face low office utilization rates.
- Population migration continues to benefit industrial markets in the Sunbelt and Mountain West.
- Several industrial port markets are also attracting investment as supply chain managers seek to further diversify ports of entry to mitigate the effects of recent disruptions to major trade routes.
- Potential new notable intraregional trends include an apparent shift in transaction volume within California toward smaller, less dense office markets and a shift in the Northeast toward less dense industrial markets.
- In addition to these regional trends, total transaction volume across the second-largest 51 office and industrial markets contracted less than transaction volume across the largest 51 markets for each product type since the first quarter of 2023 and since the same period in 2019. This likely reflects some combination of investors diversifying into smaller markets and a decline in activity among the investors who exclusively invest in the largest markets.
About the NAIOP Market Monitor

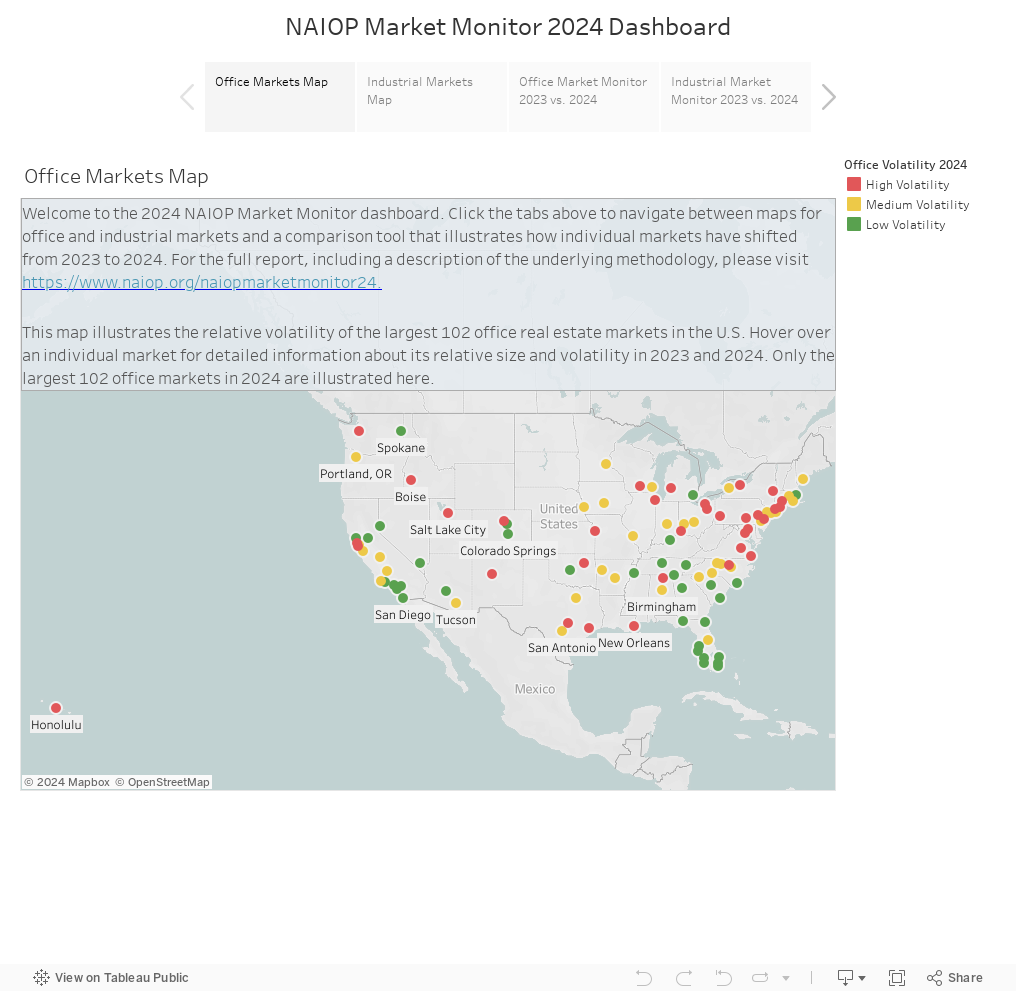
Each year, the NAIOP Market Monitor examines data provided by CoStar to describe the relative size (transaction volume) and volatility (variance in transaction volume and capitalization rates) of the largest 102 office and industrial markets in the U.S. This report looks at the first quarter of 2024 data and identifies notable changes since the first quarter of 2023. The 2023 edition performed the same analysis for the first quarter of 2023 and identified notable changes since the first quarter of 2019. Office and industrial markets are each segmented into the largest 51 and second-largest 51 markets by transaction volume. They are arranged on a two-dimensional grid with volume on the Y-axis and volatility on the X-axis. The results are displayed in Figures 1 and 2 for office markets and Figures 4 and 5 for industrial markets. Additional information about the methodology used to construct the NAIOP Market Monitor is described in the Methodology section at the end of this report. An interactive dashboard that accompanies this report visualizes changes over time for individual office and industrial markets and includes maps illustrating their relative volatility.
Office Markets
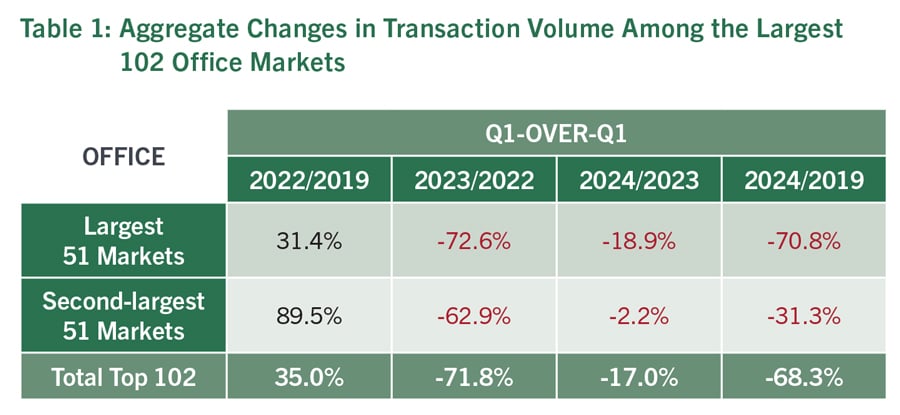
Office market transaction volume continues to decline as investors await lower interest rates and search for a bottom in asset prices. Overall transaction volume for the top 102 markets is down from the first quarter of 2023 (although not as significantly as it was between the first quarters of 2022 and 2023, when top-tier market activity dropped from $28.7 billion to just under $8 billion; see Table 1). Transaction volume in the second-largest 51 markets declined at a significantly lower rate than for the largest 51 markets, suggesting a trend of portfolio diversification into smaller markets, particularly for regional players.
An examination of trends among individual office markets indicates a continuation of patterns noted in last year’s report. The largest office markets with commuter-centric CBDs continue to struggle. The 2023 report observed that Washington, DC, and Baltimore had experienced a sharp increase in volatility since 2019. Both continue to be among the most volatile large office markets, and relative transaction volume in Baltimore declined, moving it to the bottom third of the 51 largest markets (see Figure 1). Chicago, which in 2019 had been a low-volatility market, continued to experience increasing volatility, landing it in the top third of markets by volatility in the most recent quarter.
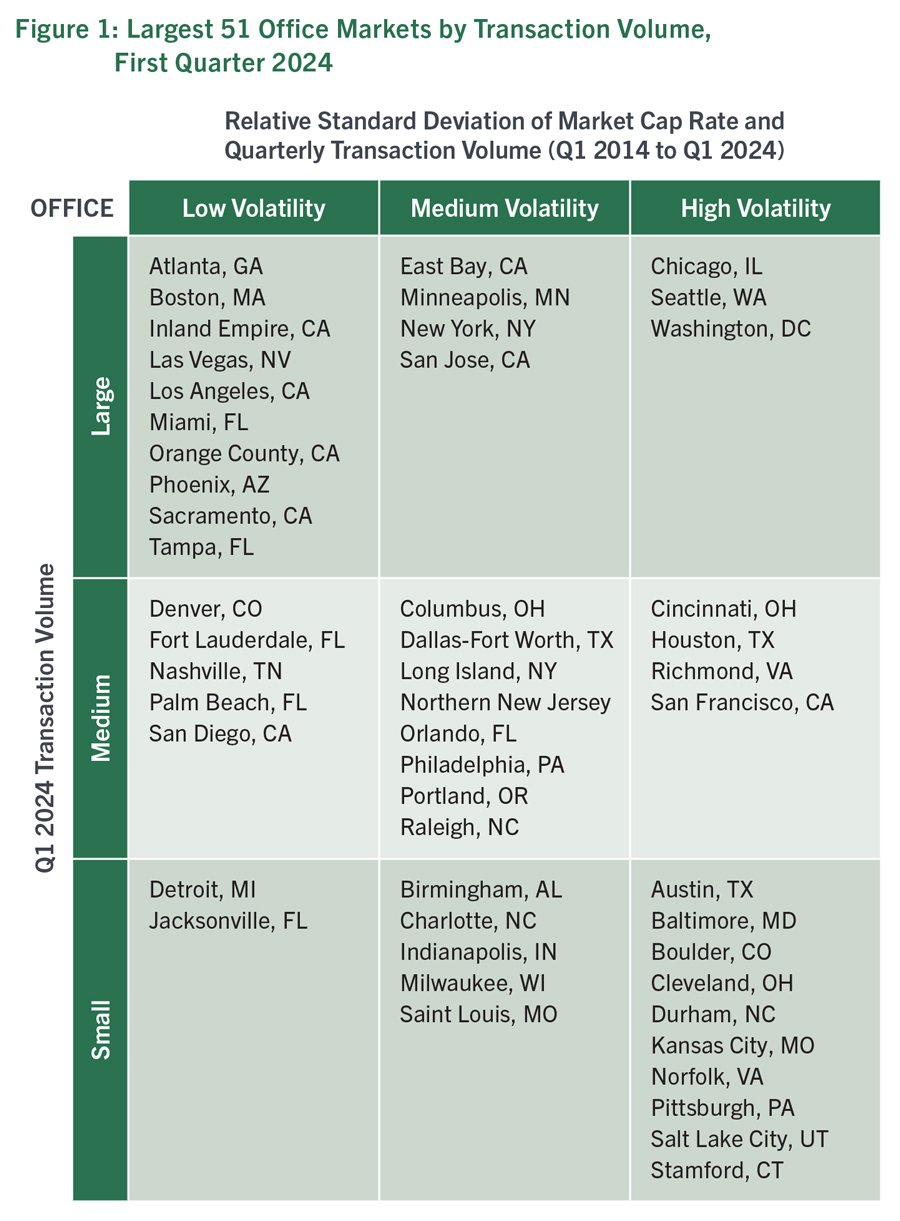
San Francisco remains a high-volatility market, and transaction volume declined so that it ranks in the middle of the largest 51 markets and is now surpassed in size by three other markets in Northern California: the East Bay, San Jose and Sacramento, which all grew in size (from medium to large within the largest 51 markets) since last year. This may be part of a larger trend within California favoring investment in less-dense cities. In Southern California, the Inland Empire now ranks in the top third of the largest 51 office markets, up from the bottom third of the same group in 2019.
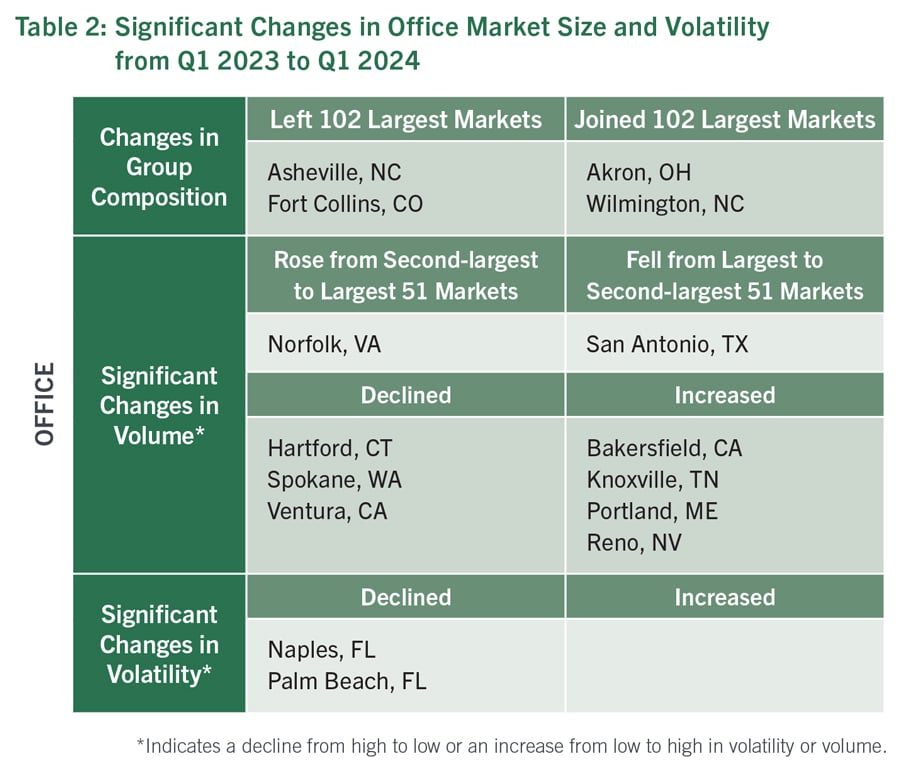
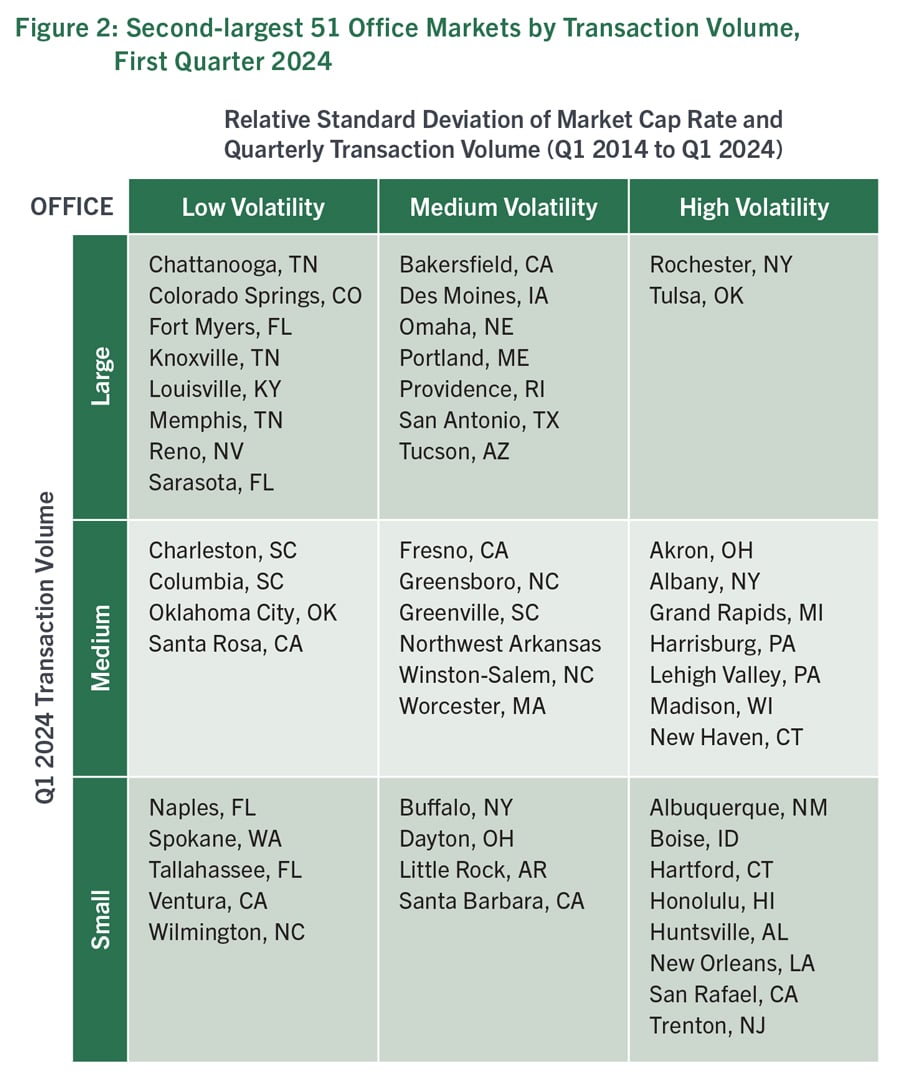
Among the second-largest 51 markets (see Figure 2), Bakersfield grew from the smallest third to the largest third over the last year. Nevada office markets also appear to have benefited from migration away from California’s largest, most expensive markets, with Las Vegas now in the largest third of the largest 51 markets (up from the smallest third in 2019), and Reno rising to the largest third of the second-largest 51 markets (up from the smallest third in 2023).
The 2023 report observed some shifts favoring office markets in the Sunbelt, but outside of California, the recent performance of Sunbelt markets is less clear-cut. Wilmington, North Carolina, joined the top 102 office markets; transaction volume grew significantly in Knoxville, Tennessee; and in Florida, Naples and Palm Beach both experienced a significant decline in volatility. However, Asheville, North Carolina, exited the top 102 office markets, and San Antonio, Texas, dropped from the largest 51 to the second-largest 51 markets. Norfolk, Virginia, rose from the second-largest 51 markets to the largest 51 markets, but this is a return to its relative size in 2019 and is most likely a reflection of its status as a high-volatility market.
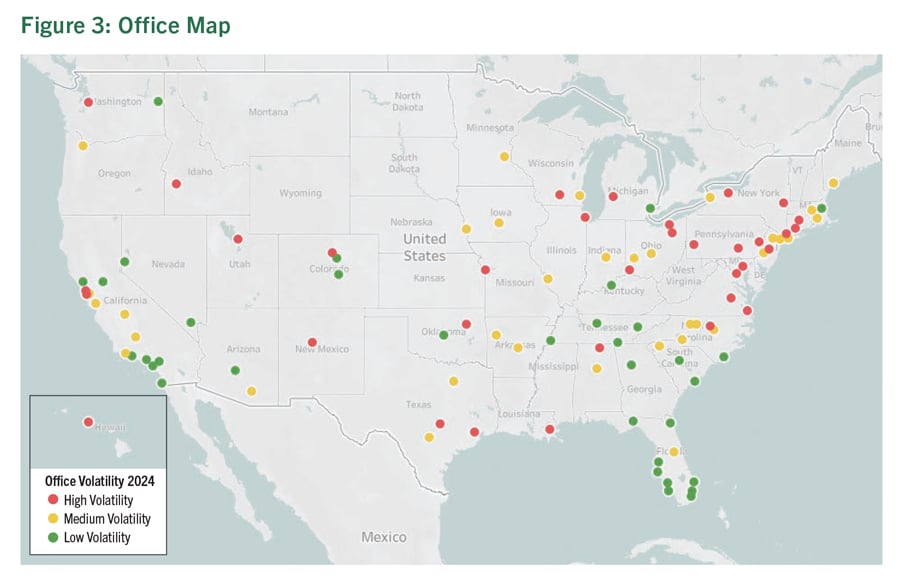
A map of relative volatility for the 102 largest office markets reveals some regional trends (Figure 3). Volatility is generally lower in California and neighboring states and most of the Southeast, moderate to high in most of the Midwest, and generally high along the East Coast between Virginia and Connecticut. An interactive version of this map is available in an accompanying dashboard that provides more information about individual markets.
Industrial Markets
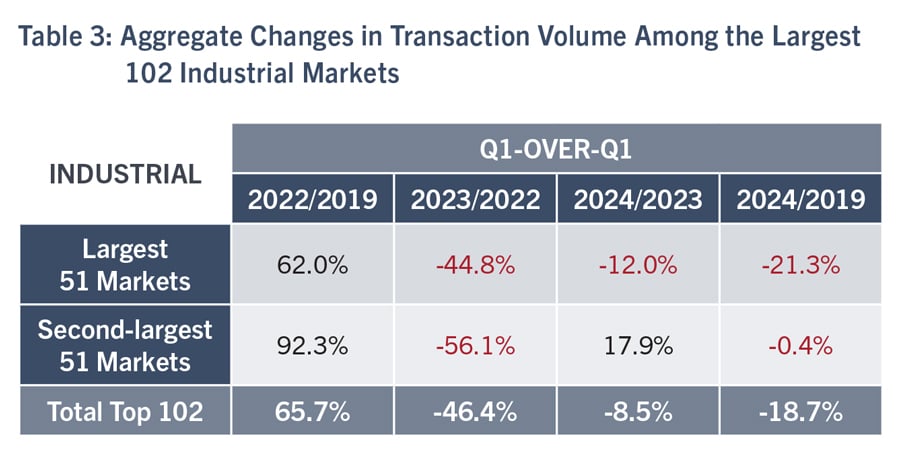
Although industrial markets attracted increased investment following the outbreak of COVID-19, transactions data show a reduction in transaction volume since the first quarter of 2022 that has continued into the first quarter of 2024 (see Table 3). This contraction came as interest rates rose and retailers slowed their expansion of logistics space to serve e-commerce deliveries. Among U.S. industrial markets, those in the second-largest group have outperformed those in the largest group in most regions. Aggregate transaction volume in the 51 largest markets was down 12% from first quarter of 2023 to the first quarter of 2024, while total volume in the second-largest 51 markets increased by 17.9%. This shows improvement compared to the 44.8% and 56% respective declines for the largest and second-largest 51 markets between the first quarter of 2022 and the first quarter of 2023. When comparing the first quarter of 2024 to the first quarter of 2019, transaction volumes in the largest 51 markets remain considerably lower, while those in the second-largest 51 markets were nearly unchanged.
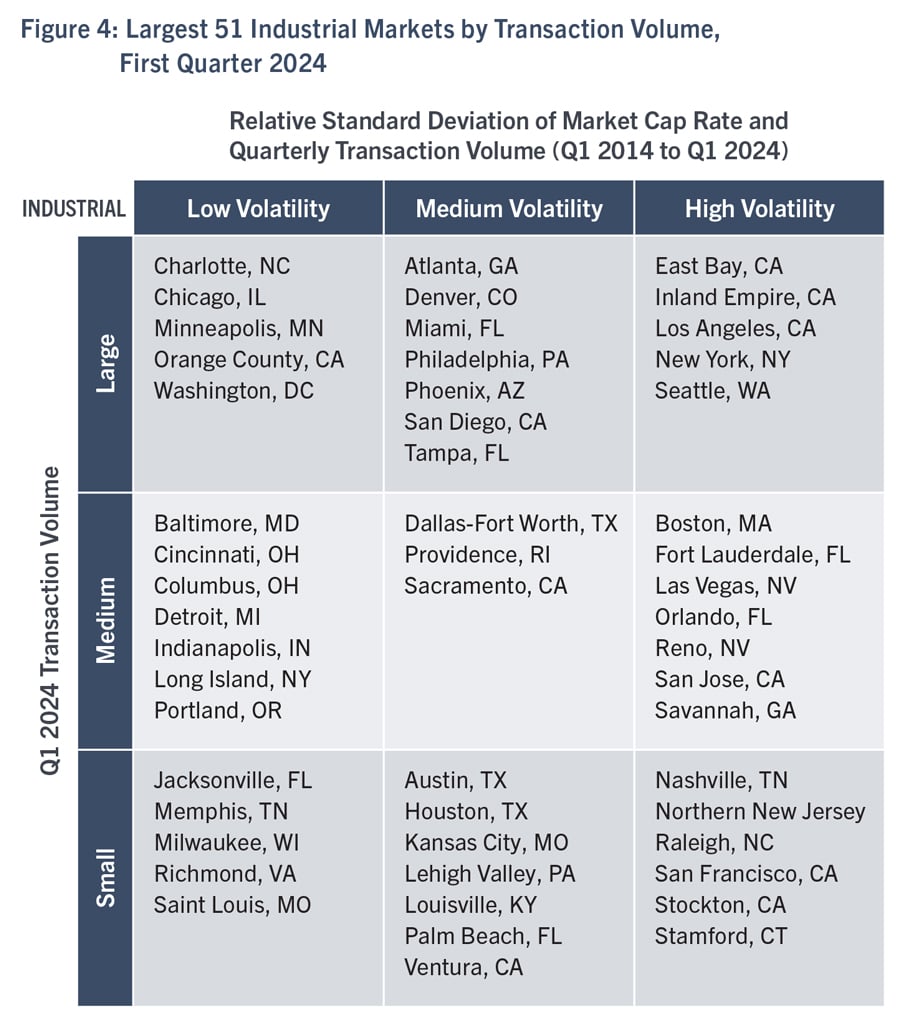
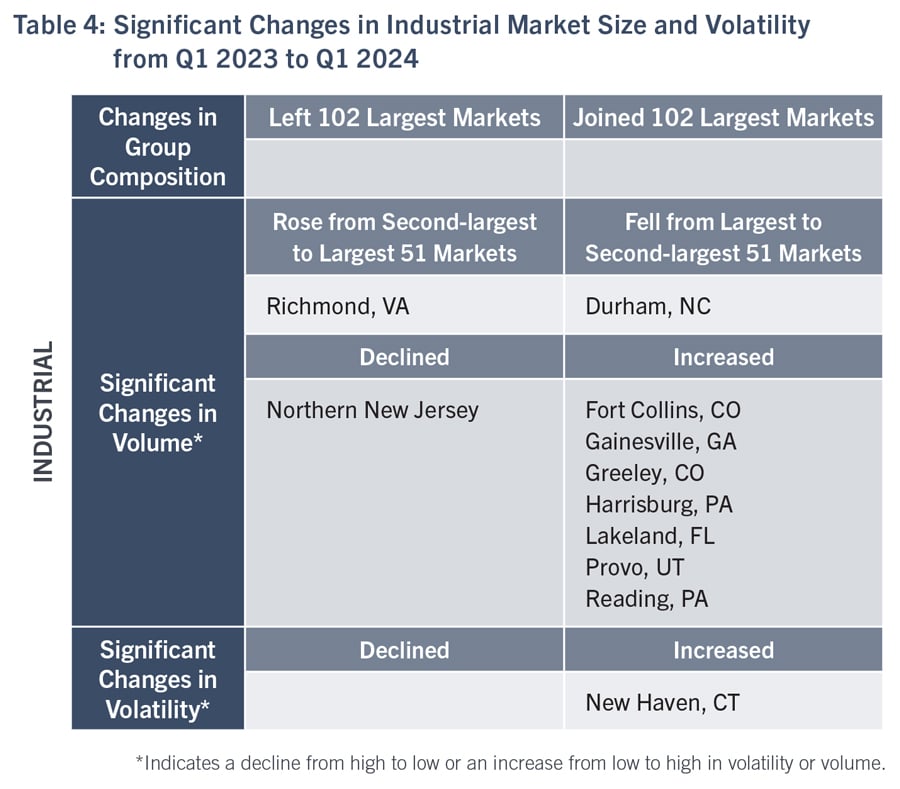
Markets in the Sunbelt and Mountain West regions continue to benefit from migration trends. Denver joined the largest third of the 51 largest industrial markets (see Figure 4). Among the second-largest markets, Fort Collins, Colorado; Greeley, Colorado; Gainesville, Georgia; and Lakeland, Florida moved from the smallest third to the largest third (see Figure 5).
However, not all Southern markets fared well this year. Durham, North Carolina, dropped from the middle third of the largest 51 markets by transaction volume down to the smallest third of the second-largest 51 markets, demonstrating its status as a high-volatility market.

Within the Northeast, there are signs that investors may be shifting transactions to markets that can serve major metropolitan areas at a lower cost than from those that are closer to population centers. Transactions increased significantly in both Harrisburg and Reading, Pennsylvania. Harrisburg is also a key market for the food industry, which has benefited from inelastic demand despite inflationary pressures. By comparison, transaction volume dropped significantly in Northern New Jersey, while New Haven, Connecticut, experienced a more modest decline in transaction volume that was accompanied by a sharp increase in volatility.
Several port markets attracted increased investment activity. This reflects a trend of supply chain managers diversifying ports of entry in response to disruptions to long-standing trade routes such as tariff disputes, the shutdown of Chinese ports during the COVID-19 pandemic, low water levels in the Panama Canal and attacks on shipping in the Red Sea. Markets that experienced moderate increases in relative transaction volume include Miami, the East Bay (in the San Francisco Bay Area), Seattle, Tampa, Baltimore and Savannah. Savannah’s growth continues a trend observed in last year’s report: In the first quarter of 2019, it ranked in the middle third of the second-largest 51 markets by transaction volume, whereas in the most recent quarter, it ranked in the middle third of the largest 51 markets.
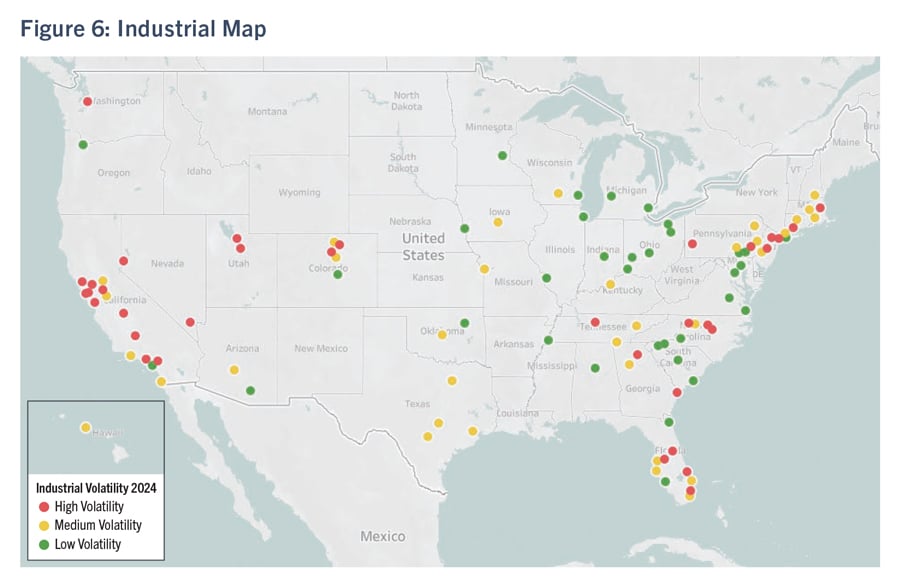
A map of the relative volatility among the 102 largest industrial markets (Figure 6) reveals regional patterns that differ somewhat from those observed among office markets. Volatility is higher among most markets in the Northeast, Florida, Georgia, North Carolina, California, Washington and the Mountain West, with low to moderate volatility for most markets in the rest of the country.
Methodology
The NAIOP Market Monitor analyzes data on transaction volume and capitalization rates provided by CoStar. It takes the largest 102 office and industrial markets in the U.S. as measured by average transaction volume over the last 10 years and sorts them into the largest 51 and next-largest 51. These markets are then arranged in two-dimensional three-by-three grids. The grid’s vertical axis sorts each set of 51 markets into top, middle and bottom thirds for transaction volume in the most recent quarter as a current measurement of market size (large, medium and small). The grid’s horizontal axis sorts these markets by their volatility, measured as an equal weighting of the relative standard deviation of their respective capitalization (or “cap”) rates and the relative standard deviation of their respective quarterly transaction volume over a 10-year period. The bottom, middle and top third of markets are classified as “low volatility,” “medium volatility” and “high volatility.” Relative standard deviation was chosen as the best measurement of volatility; it accounts for a market’s size (e.g., small changes in transaction volume are more significant in smaller markets) and average cap rate (a small change in cap rate has a greater effect on real values in a market that previously had a low cap rate than it does in a market that had a high cap rate). The resulting grids allow a user to simultaneously compare markets by size and volatility.
The relative volatility between the largest 51 and the next-largest 51 office and industrial markets can be compared on a percentage basis at a point in time. For this report’s purposes, the authors compared the relative volatility of each market in the first quarter of 2024. Some markets are outliers from the group average, so readers should not directly compare volatility for individual markets that appear in the 51 largest office or industrial markets to those that appear in the second-largest 51 markets.
About NAIOP
NAIOP, the Commercial Real Estate Development Association, is the leading organization for developers, owners and related professionals in office, industrial, retail and mixed-use real estate. NAIOP comprises some 21,000 members in North America. NAIOP advances responsible commercial real estate development and advocates for effective public policy. For more information, visit naiop.org.
The NAIOP Research Foundation was established in 2000 as a 501(c)(3) organization to support the work of individuals and organizations engaged in real estate development, investment and operations. The Foundation’s core purpose is to provide information about how real properties, especially office, industrial and mixed-use properties, impact and benefit communities throughout North America. The initial funding for the Research Foundation was underwritten by NAIOP and its Founding Governors with an endowment established to support future research. For more information, visit naiop.org/foundation.
About the Authors
Maria Sicola and Elle Saling have partnered on many data and analytics initiatives, including developing market forecasting models, global data warehousing databases, and benchmarking tools for leasing analysis using evolving data technologies and analytics to support decision-making and facilitate public discussion. Charles Warren is the senior quantitative lead for the Real Estate Analysis and Value Capture practice at WSP, focusing on leveraging transit-oriented development to increase funding for transit infrastructure. Sicola holds an MBA from Manhattan College, an MS in Information Science from Rutgers University, and a BA from Seton Hall University; additionally, she completed post-graduate studies in statistics and experimental design at Purdue University. Saling holds an Executive Management Certification from the UCLA Anderson School of Management and a BS in Business Administration from the California Polytechnic University at San Luis Obispo. Warren holds a Ph.D. in City and Regional Planning from the University of California Berkeley and an MA in Urban Studies from the John W. Draper Interdisciplinary Program at New York University.
Media Inquiries
Please contact Kathryn Hamilton, vice president for marketing and communications, at hamilton@naiop.org.
Disclaimer
This project is intended to provide information and insights to industry practitioners and does not constitute advice or recommendations. NAIOP disclaims any liability for actions taken as a result of this project and its findings.
© 2024 NAIOP Research Foundation