


Industrial Space Demand Forecast, Third Quarter 2024
Release Date: August 2024
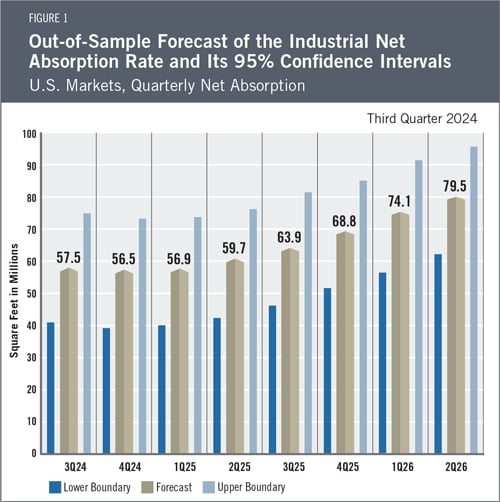
Total U.S. industrial net absorption in the first half of 2024 totaled 67.1 million square feet, down substantially from a historic peak in absorption in 2021, when it totaled 749.3 million square feet for the year, according to historical data provided by CoStar. However, despite increased uncertainty about the economic outlook for the second half of 2024, the current NAIOP Industrial Space Demand Forecast projects that the national industrial real estate market will continue the trend of positive net absorption for the foreseeable future. Total net absorption for the second half of 2024 is forecast to be approximately 114 million square feet, full-year absorption in 2025 is forecast to be around 249 million square feet, and absorption in the first half of 2026 is forecast to be approximately 154 million square feet (see Figure 1 for quarterly projections). This forecast assumes a “soft landing” as defined by a gradual lowering of interest rates as inflation falls without any significant harm to employment or a macroeconomic recession. If a “hard landing” materializes, industrial net absorption could significantly underperform the forecast. Given recent volatility shocks in equity markets and mixed employment data, the possibility of a hard landing (i.e., a recession) appears higher than was the case at the beginning of the year.
New Data Source for NAIOP Space Demand ForecastsBeginning with this report, the NAIOP Industrial and Office Space Demand Forecasts will refer to historical net absorption and other historical market data provided by CoStar. Past editions of the Space Demand Forecasts utilized and tracked historical data provided by CBRE Econometric Advisors. Due to the change in data sources, the current forecast is not directly comparable to past forecasts. Comparisons between forecast absorption and actual absorption will resume in 2025. For more information about the data used in this forecast, please refer to the Key Inputs and Disclaimers section at the end of the report. |
The Industrial Market
With a consensus that the Federal Reserve will cut interest rates starting in September, the potential for increased industrial leasing activity in the second half of 2024 and onward is substantial, assuming core consumer demand remains intact. High interest rates are a headwind not only for real estate developers and investors, but also industrial space occupiers who must borrow to finance buildouts, equipment, inventory and materials. With interest rates heading lower, businesses may reaccelerate capital investment plans that have slowed since 2022’s spike in interest rates.
Strong retail sales figures in July (up 1% for the month) suggest consumers will continue supporting final demand for industrial space.1 Although the sector no longer benefits from the robust inventory growth experienced in 2021 and 2022, inventories are not shrinking either; combined retailer and wholesaler inventories remain unchanged from a year ago after accounting for producer price inflation.2 Instead, recent growth in demand for industrial space can be attributed to the resumed expansion of e-commerce, which reached 15.9% of total retail sales in the first quarter of 2024, up from 14.9% the prior year, and is approaching its historical peak of 16.4% in the second quarter of 2020.3 Notably, Amazon has returned to expanding its logistics footprint with a significant increase in leasing and acquisition activity.4 E-commerce requires approximately three times as much space to service as traditional brick-and-mortar retail,5 and its continued growth should support increased demand for industrial space, even if total retailer and wholesaler inventories remain unchanged.
Net absorption lagged substantially in the first half of 2024 compared with the same period in 2023 (67.1 million square feet vs. 172.7 million square feet). Vacancy has risen slightly to 5.9% (compared with 4.2% in the second quarter of 2023) as net deliveries continue to outpace net absorption but remains below the average since 2008 of 6.3%. Asking rents have grown 4.3% year over year, consistent with a relatively healthy market. Rents should continue to grow absent a macroeconomic shock. Among U.S. Census regions, absorption was strongest in the South,6 which experienced 53.7 million square feet of net absorption (80% of the national total). However, as in every other region, completions outpaced absorption, leading vacancies to rise to 6.5%.
Economic Trends
At the time of writing, the U.S. economy appears strong, with second-quarter GDP estimated to have grown at an annualized rate of 2.8%.7 However, the most recent Employment Situation report from the Bureau of Labor Statistics shows that the unemployment rate has increased 80 basis points year over year to 4.3%,8 the first significant increase in unemployment since the pandemic. This has caused a reevaluation of the prospects for the U.S. economy, as many believe the probability of recession and sustained job loss for the remainder of the year and possibly into 2025 is now higher than was the case earlier this year.
It is difficult to accurately forecast the direction of unemployment over the next several months, and this uncertainty has led to higher volatility in equity markets. There is near-perfect consensus that the Federal Reserve will begin lowering rates by its September meeting, with some now expecting the Fed to move more aggressively before the end of the year. While this may sound like a welcome event for many, it is a sign that the economy’s resilience to higher interest rates may have been overestimated and the Fed may have waited too long to act. This reaction may lead to higher volatility for equity markets in the near term, but declining interest rates are likely to be supportive of rate-sensitive sectors such as commercial real estate, assuming the economy can avoid a severe or protracted recession.
The Forecast Model
The authors utilize various explanatory drivers in the forecast’s statistical model, such as lagged net absorption, real gross domestic product growth, inflation and output gaps, monetary policy, and seasonal effects. This quarter, the authors began using data from CoStar as the primary source of data on the national industrial market; historical data from CoStar was used to apply an exponential smoothing technique to remove seasonality.
The forecast for industrial absorption in the second half of 2024 is 114 million square feet, with lower and upper boundaries of 80 and 148.1 million square feet, respectively. The full-year forecast for industrial absorption in 2025 is 249.3 million square feet, with lower and upper boundaries of 181.3 and 317.4 million square feet, respectively. The predicted quarterly net absorption during the first half of 2026 is 153.5 million square feet, with lower and upper boundaries of 119.5 and 187.6 million square feet, respectively. By comparison, full-year net absorption was 749.3 million square feet in 2021, 625.6 million square feet in 2022, and 289.7 million square feet in 2023.
Key Inputs and Disclaimers
The predictive model is funded by the NAIOP Research Foundation and was developed by Hany Guirguis, Ph.D., and Randy Anderson, Ph.D., formerly of the University of Central Florida. The model, which forecasts demand for industrial space at the national level, utilizes variables that comprise the entire supply chain and lead the demand for space, resulting in a model that can capture most changes in demand.
While leading economic indicators have been able to forecast recessions and expansions, the indices used in this study are constructed to forecast industrial real estate demand expansions, peaks, declines and troughs. The Industrial Space Demand model was developed using the Kalman filter approach, where the regression parameters are allowed to vary with time and thus are more appropriate for an unstable industrial real estate market.
The forecast is based on a process that involves testing more than 40 economic and real estate variables that theoretically relate to the demand for industrial space, including varying measures of employment, GDP, exports and imports, and air, rail and shipping data. Leading indicators that factor heavily into the model include the Federal Reserve Board’s Index of Manufacturing Output (IMO), the Purchasing Managers Index (PMI) from the Institute of Supply Management (ISM), and historical net absorption data provided by CoStar. Historical industrial real estate market data are provided by CoStar, which assumes no responsibility for this forecast. The dataset used for the forecast includes all industrial and flex-industrial properties in the 390 largest U.S. markets tracked by CoStar, regardless of property size or owner occupancy status. Net absorption and other real estate market data identified in this report may vary when compared with other datasets.
Authors
Hany Guirguis, Ph.D., Professor, Economics and Finance, Manhattan College
Joshua Harris, Ph.D., Executive Director, Fordham Real Estate Institute, Fordham University
Media Inquiries
Please contact Kathryn Hamilton, vice president for marketing and communications, at hamilton@naiop.org.
1 U.S. Census Bureau, “Advance Monthly Sales for Retail and Food Services,” news release, August 15, 2024, https://www.census.gov/retail/sales.html.
2 Year-over-year growth of 2.7% in June 2024 matches the rate of PPI inflation for the same period. See U.S. Census Bureau, “Manufacturing and Trade Inventories and Sales: June 2024,” August 15, 2024, https://www.census.gov/mtis/current/index.html; and U.S. Bureau of Labor Statistics, “Producer Price Index News Release summary,” news release, August 13, 2024, https://www.bls.gov/news.release/ppi.nr0.htm.
3 U.S. Census Bureau, “Quarterly Retail E-Commerce Sales,” May 17, 2024, https://www.census.gov/retail/ecommerce.html.
4 Liz Young, “Amazon Is Reviving Its Logistics Expansion and Reshaping Its U.S. Distribution,” The Wall Street Journal, May 22, 2024, https://www.wsj.com/articles/amazon-is-reviving-its-logistics-expansion-and-reshaping-its-u-s-distribution-390516b2.
5 Estimate from Green Street as described in Peter Grant, “Don’t Build That E-Commerce Warehouse in My Backyard, More Communities Say,” The Wall Street Journal, February 20, 2024, https://www.wsj.com/business/logistics/dont-build-that-e-commerce-warehouse-in-my-backyard-more-communities-say-5e35625a.
6 Consists of the states of Alabama, Arkansas, Delaware, Florida, Georgia, Kentucky, Louisiana, Maryland, Mississippi, North Carolina, Oklahoma, South Carolina, Tennessee, Texas, Virginia and West Virginia, and the District of Columbia.
7 Bureau of Economic Analysis, “Gross Domestic Product, Second Quarter 2024 (Advance Estimate),” news release, July 25, 2024, https://www.bea.gov/news/2024/gross-domestic-product-second-quarter-2024-advance-estimate.
8 U.S. Bureau of Labor Statistics, “Employment Situation Summary,” news release, August 2, 2024, https://www.bls.gov/news.release/empsit.nr0.htm.
