


Industrial Space Demand Forecast, First Quarter 2025
Release Date: March 2025
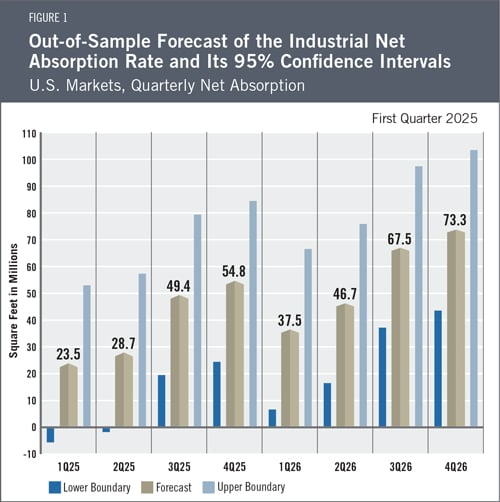
In the second half of 2024, U.S. industrial net absorption totaled 96.9 million square feet, bringing the annual total to just 170.8 million square feet. This is the lowest annual rate since 2011, as long-term interest rates remained elevated despite the Federal Reserve’s initial cuts to the federal funds rate. Net absorption in the fourth quarter slowed to only 37.0 million square feet, the worst-performing fourth quarter since 2009. Given the negative expected effect of higher long-term interest rates on near-term demand for industrial space, the current NAIOP Industrial Space Demand Forecast projects that net absorption will slow further to only 52.2 million square feet in the first half of 2025 but will then accelerate in the second half to end the full year at 156.4 million square feet of positive absorption. The Forecast projects 224.9 million square feet of positive absorption in 2026 (see Figure 1 for quarterly projections).
The expectation for stronger demand growth after the first half of 2025 is based on projections that the economy will remain robust and the yield curve will continue to normalize with time. However, the authors have expanded the range between the upper and lower boundaries of the forecast to reflect greater uncertainty about both the economy and fiscal policy. The future health of U.S. markets for industrial real estate will hinge on the economy’s direction, consumers’ ability to spend, and the unique impacts of trade policy shifts. Demand growth is expected to slow as it reverts to the mean after several years of strong performance.
The Industrial Market
An analysis of historical data provided by CoStar suggests that the pandemic-era industrial leasing boom has ended. The ratio of net absorption to net deliveries fell to 33% in 2024 from a high of 170% in 2021 (meaning for every one square foot delivered, 1.7 was absorbed), despite quarterly deliveries falling by more than half on a year-over-year basis. Deliveries exceeded absorption by 103.3 million square feet in the second half, causing the average vacancy rate to increase from 5.9% to 6.2%, the highest rate since 2015. Developers have been responsive to the decline in demand, with the pipeline of projects currently under construction at 492.8 million square feet. This is down from a record high of more than 1 billion square feet in the third quarter of 2022 and nearly mirrors the size of the pipeline at the end of 2019 (493.0 million square feet). However, as long as deliveries exceed absorption, the average vacancy rate will continue to rise. As expected, annual market rent growth fell from 6.9% in 2023 to just 2.8% in 2024, the slowest annual growth rate since 2012.
Slowing industrial net absorption and rising vacancy rates contrast with strong fundamentals for retailers and wholesalers, the largest occupiers of leasable industrial real estate. In 2024, total annual retail sales excluding motor vehicles and auto parts dealers were up 2.9% from 2023,1 e-commerce sales for the year were up 1.1%,2 and combined wholesaler and retailer inventories in December 2024 were up 2.5% compared with the same month in 2023.3 Relatively anemic demand for industrial space in the face of continued growth in consumer spending suggests that occupiers remain cautious about future economic conditions and that continued high interest rates make them less willing to occupy space ahead of current needs than in earlier years.
Economic Trends
While industrial net absorption may have underperformed in 2024, the U.S. economy remained strong, with gross domestic product growing at a 2.3% annual rate in the fourth quarter and 2.8% for the full year.4 Job growth slowed in 2024, and unemployment remains low at just 4.0%, according to the latest reading from the Bureau of Labor Statistics.5 The U.S. economy appears healthy by most measures and is widely forecast to continue growing in 2025 and beyond.
Nonetheless, all eyes remain fixed on inflation, which has been moving upward since November 2024. As measured by the Consumer Price Index, inflation has risen back to an annual rate of 3%,6 stubbornly above the Federal Reserve’s stated target of 2%. At present, most economists expect both the federal funds rate and long-term interest rates to remain near current levels. The recent rise in long-term bond yields frequently has been attributed to the presidential election results, with observers arguing that rising yields reflect expectations of stronger future economic growth, higher deficits, tariff-induced inflation or some combination of the three. Higher yields signal a risk of persistently higher inflation, which could require that the Federal Reserve keep the federal funds rate higher for longer.
On the other hand, stock market indices and valuation metrics remain near all-time highs, reflecting general optimism about the economy and prospects for U.S. businesses. The Conference Board’s Consumer Confidence Index declined in January to 104.1 but has remained relatively steady since 2022.7 The Conference Board Measure of CEO Confidence also declined slightly in the fourth quarter to 51,8 a reading that still reflected more positive than negative responses.
The Forecast Model
The authors utilize various explanatory drivers in the forecast’s statistical model, such as lagged net absorption, real gross domestic product growth, inflation and output gaps, monetary policy, and seasonal effects. The authors used data from CoStar as the primary source of data on the national industrial market. Historical data from CoStar was used to apply an exponential smoothing technique to remove seasonality.
The full-year forecast for industrial absorption in 2025 is 156.4 million square feet, with lower and upper boundaries of 36.6 and 276.1 million square feet, respectively. The predicted full-year net absorption for 2026 is 224.9 million square feet, with lower and upper boundaries of 105.2 and 344.7 million square feet, respectively. By comparison, full-year net absorption was 752.1 million square feet in 2021, 622.4 million square feet in 2022, 294.8 million square feet in 2023, and 170.8 million square feet in 2024.
Actual Versus Forecast
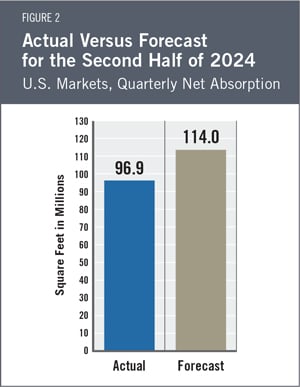
Since the Industrial Space Demand forecast switched to using data from CoStar with the third-quarter report, the current report offers the first opportunity to measure the forecast’s performance using the new data. Figure 2 compares actual net absorption in the second half of 2024 to what the third-quarter forecast had projected. The first year-over-year evaluation of the forecast will be provided when full-year data are available for 2025.
During the second half of 2024, 96.9 million square feet of industrial space was absorbed, compared with the forecast of 114 million square feet. It is worth noting that the underperformance in the second half of 2024 came primarily from a miss in the fourth quarter (37.0 vs. 56.5 million square feet, compared to a negligible difference of 59.8 vs. 57.5 million square feet in the third quarter). While any single quarter’s result could be an outlier, the decline in demand is aligned with a significant shift in forward interest rate expectations. To date, the 10-year treasury yield has moved up approximately 100 basis points (bps) since the Federal Reserve finished cutting the federal funds rate by a cumulative 100 bps, a move that began at the start of the fourth quarter and before the election. Thus, there is reason to believe that the decline in absorption results from a shift in industrial space users’ outlook and decision-making process.
Key Inputs and Disclaimers
The predictive model is funded by the NAIOP Research Foundation and was developed by Hany Guirguis, PhD, and Randy Anderson, PhD, formerly of the University of Central Florida. The model, which forecasts demand for industrial space at the national level, utilizes variables that comprise the entire supply chain and lead the demand for space, resulting in a model that can capture most changes in demand.
While leading economic indicators have been able to forecast recessions and expansions, the indices used in this study are constructed to forecast industrial real estate demand expansions, peaks, declines and troughs. The Industrial Space Demand model was developed using the Kalman filter approach, where the regression parameters are allowed to vary with time and thus are more appropriate for an unstable industrial real estate market.
The forecast is based on a process that involves testing more than 40 economic and real estate variables that theoretically relate to the demand for industrial space, including varying measures of employment, GDP, exports and imports, and air, rail and shipping data. Leading indicators that factor heavily into the model include the Federal Reserve Board’s Index of Manufacturing Output (IMO), the Purchasing Managers Index (PMI) from the Institute of Supply Management (ISM), and historical net absorption data provided by CoStar. Historical industrial real estate market data are provided by CoStar, which assumes no responsibility for this forecast. The dataset used for the forecast includes all industrial and flex-industrial properties in the 390 largest U.S. markets tracked by CoStar, regardless of property size or owner occupancy status. Net absorption and other real estate market data identified in this report may vary when compared with other datasets.
Authors
Hany Guirguis, Ph.D., Interim Dean, O’Malley School of Business and Professor, Economics and Finance, Manhattan College
Joshua Harris, Ph.D., Executive Director, Fordham Real Estate Institute, Fordham University
Media Inquiries
Please contact Kathryn Hamilton, vice president for marketing and communications, at hamilton@naiop.org.
1 U.S. Census Bureau, “Advance Monthly Sales for Retail and Food Services,” news release, February 14, 2025, https://www.census.gov/retail/sales.html.
2 U.S. Census Bureau, “Quarterly Retail E-Commerce Sales,” February 19, 2025, https://www.census.gov/retail/ecommerce.html.
3 U.S. Census Bureau, “Manufacturing and Trade Inventories and Sales: December 2024,” February 14, 2025, https://www.census.gov/mtis/current/index.html.
4 Bureau of Economic Analysis, “Gross Domestic Product, 4th Quarter and Year 2024 (Advance Estimate),” news release, January 30, 2025, https://www.bea.gov/news/2025/gross-domestic-product-4th-quarter-and-year-2024-advance-estimate.
5 U.S. Bureau of Labor Statistics, “Employment Situation Summary,” news release, February 7, 2025, https://www.bls.gov/news.release/empsit.nr0.htm.
6 U.S. Bureau of Labor Statistics, “Consumer Price Index Summary,” news release, February 12, 2025, https://www.bls.gov/news.release/cpi.nr0.htm.
7 The Conference Board, “US Consumer Confidence Retreated in January,” news release, January 28, 2025, https://www.conference-board.org/topics/consumer-confidence.
8 The Conference Board, “CEO Confidence Retreated Slightly in Q4 2024,” news release, October 24, 2024, https://www.conference-board.org/topics/ceo-confidence.
* Research reports are complimentary to all audiences. Webinars are free for members and paid for nonmembers.
