Industrial Space Demand Forecast, Third Quarter 2022
Release Date: August 2022
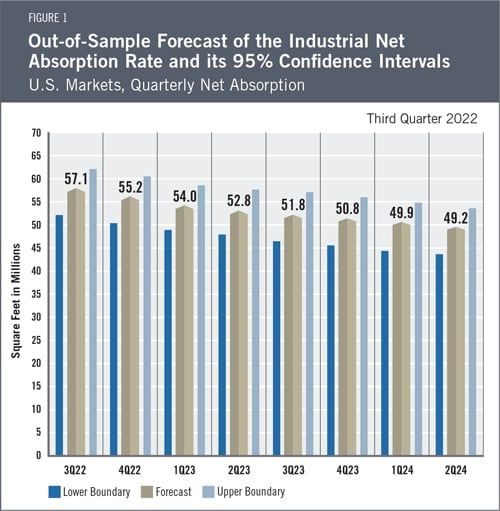
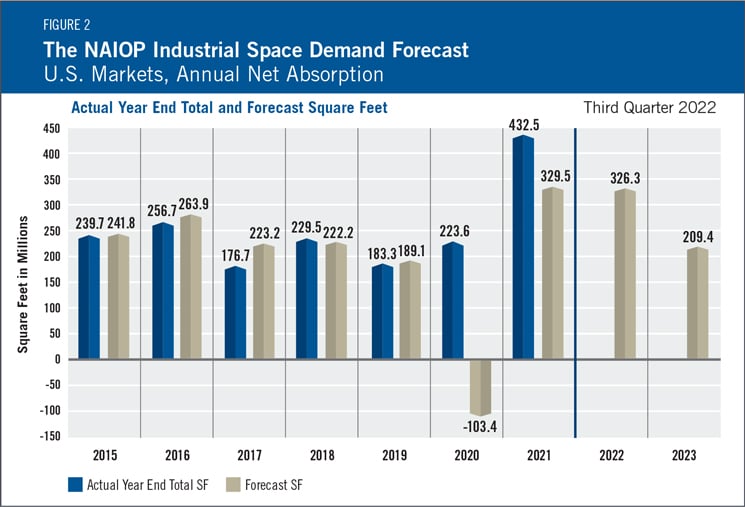
Amid lower pressure on global supply chains, increasing inventory carrying costs, a cooling economy and a decrease in the rate of e-commerce expansion, retailers and logistics firms have slowed the rate at which they acquired additional industrial space this year. Net absorption of industrial space in the first two quarters of 2022 was 151.2 million square feet, down sharply from 2021’s record pace but still notably higher than in prior years (see Figure 2). The authors expect the still-hot industrial market to cool, and they forecast that the net absorption rate will continue to decline until it returns to the pre-pandemic trend. Total net absorption of industrial space in the second half of 2022 is forecast to be 112.4 million square feet, and full-year absorption in 2023 is forecast to be 209.4 million square feet (see Figure 1 for quarterly projections).
The Industrial Market
Supply chain congestion eased during the first half of 2022, as illustrated by the decline in the Federal Reserve Bank of New York’s Global Supply Chain Pressure Index from 4.35 in December 2021 to 2.41 in June 2022. As a result, retailers and logistics firms have shown less interest in leasing or buying industrial space before it is needed, a trend that contributed to higher absorption in 2021. Amazon’s decision to substantially scale back its expansion plans is the most prominent example of this shift in demand for industrial space. Nonetheless, smaller e-commerce firms, and even traditional retailers, continue to lease more distribution space despite slowing e-commerce growth as more consumers return to shopping at bricks-and-mortar retail. Industrial vacancy rates remain historically low as the ability to supply new space continues to face physical and political limitations in land-constrained markets. These low vacancy rates continue to cause asking rents, and ultimately transaction prices, to increase. Premium prices are being paid for properties with soon-to-expire leases and even vacancies as they allow owners to lease out more space at record-high market rates.

As supply chain backlogs continue to improve, the delivery of new industrial space has absorbed some of the pent-up demand. Yet the demand for new space still has the markets out of equilibrium, a trend likely to continue for at least several quarters. Rising interest rates are increasing borrowing and inventory carrying costs for industrial tenants, limiting their appetite for distribution space, and a possible recession would further soften demand. However, even if all new properties without pre-leases were delivered as vacant this year, the national vacancy rate would still be close to its historical, long-run average.
Economic Trends
According to the Bureau of Economic Analysis, real gross domestic product (GDP) declined -1.6% in the first quarter of 2022.1 This decline is partially due to inflation, which in June reached a 40-year high of 9.1% year-over-year.2 Since the publication of the first-quarter Industrial Space Demand Forecast in February, the median projection for real GDP growth in 2022 by Federal Reserve Board members and Federal Reserve Bank presidents has been revised downward from 5.5% to 1.7%. Similarly, the projected growth rates for 2023 and 2024 were revised downward from 4.0% and 2.2% to 1.7% and 1.9%, respectively.3 High inflation prompted the Federal Reserve to raise interest rates by 0.75% in June—the largest single increase since 1994—and raise them again by another 0.75% in July. Substantial uncertainty remains about how high the Fed will need to raise rates to contain inflation, and how severe the effects will be for the U.S. economy.
Inflation has also had a pronounced effect on the Consumer Confidence Index, which is now at its lowest level since February 2021,4 even though the national unemployment rate currently stands at a historically low 3.6%.5 By reference, the unemployment rate was 3.5% in February 2020, immediately preceding the pandemic. Although consumer confidence has declined, consumer spending remains strong, as evidenced by a willingness to travel despite higher airline fares and gas prices. Nonetheless, continued price inflation for energy, food and housing may eventually lead consumers to decrease discretionary spending on goods. The good news for consumers is that gas prices have been declining, though they remain higher than in recent years. If the U.S. were to enter an economic recession in the coming months, it would likely impair consumer spending, resulting in lower demand for goods and for the space needed to store those goods.
The Forecast Model
The authors utilize various explanatory drivers in the forecast’s statistical model, such as the lagged net absorption, real gross domestic product growth, inflation and output gaps, monetary policy, and seasonal effects. The current forecast has been revised downward to near the lower boundary of the previous forecast, which assumed that end-users of industrial space would cease occupying more space than they currently need in 2022. That lower boundary had predicted that net absorption during the first half of 2022 would be 136.8 million square feet, whereas the actual net absorption rate was 151.2 million square feet. The current forecast for industrial net absorption in the second half of 2022 is 112.4 million square feet, with lower and upper boundaries of 102.4 and 122.3 million square feet, respectively. The full-year forecast for industrial absorption in 2023 is 209.4 million square feet, with lower and upper boundaries of 189.5 and 229.3 million square feet. The forecast for the first half of 2024 is 99.1 million square feet of net absorption, with lower and upper boundaries of 89.2 and 109.1 million square feet.

Actual Versus ForecastNet absorption in 2021 was almost double the absorption observed in 2020, reflecting rapid economic growth, continued growth in consumer spending on goods and the expansion of e-commerce (see Figure 2). During 2021, 432.5 million square feet of industrial space was absorbed, compared with the forecast of 329.5 million square feet. Note that CBRE Econometric Advisors substantially revised its historical absorption data for the first two quarters of 2021, increasing reported absorption in the first half of the year by 34 million square feet. Since lagged absorption has a significant effect on the forecast, the lower absorption data that was then available resulted in a lower forecast for the second half of 2021 than would have been the case if the authors had received the current version of the historical data. |
Key Inputs and Disclaimers
The predictive model is funded by the NAIOP Research Foundation and was developed by Guirguis and Randy Anderson, PhD, formerly of the University of Central Florida. The model, which forecasts demand for industrial space at the national level, utilizes variables that comprise the entire supply chain and lead the demand for space, resulting in a model that can capture most changes in demand.
While leading economic indicators have been able to forecast recessions and expansions, the indices used in this study are constructed to forecast industrial real estate demand expansions, peaks, declines and troughs. The Industrial Space Demand model was developed using the Kalman filter approach, where the regression parameters are allowed to vary with time and thus are more appropriate for an unstable industrial real estate market.
The forecast is based on a process that involves testing more than 40 economic and real estate variables that theoretically relate to demand for industrial space, including varying measures of employment, GDP, exports and imports, and air, rail and shipping data. Leading indicators that factor heavily into the model include the Federal Reserve Board’s Index of Manufacturing Output (IMO), the Purchasing Managers Index (PMI) from the Institute of Supply Management (ISM) and net absorption data from CBRE Econometric Advisors.
Authors
Hany Guirguis, Ph.D., Professor, Economics and Finance, Manhattan College
Michael J. Seiler, DBA, J.E. Zollinger Professor of Real Estate & Finance, College of William & Mary
Media Inquiries
Please contact Kathryn Hamilton, vice president for marketing and communications, at hamilton@naiop.org.
1 Bureau of Economic Analysis, “Gross Domestic Product (Third Estimate), GDP by Industry, and Corporate Profits (Revised), First Quarter 2022,” news release, June 29, 2022, https://www.bea.gov/news/2022/gross-domestic-product-third-estimate-gdp-industry-and-corporate-profits-revised-first#:.
2 U.S. Bureau of Labor Statistics, “Consumer Price Index Summary,” news release, July 13, 2022, https://www.bls.gov/news.release/cpi.nr0.htm.
3 Board of Governors of the Federal Reserve System, “June 15, 2022: FOMC Projections materials,” news release, June 15, 2022,
https://www.federalreserve.gov/monetarypolicy/fomcprojtabl20220615.htm.
4 The Conference Board, “Consumer Confidence Falls Again in June,” news release, June 28, 2022, https://www.conference-board.org/topics/consumer-confidence.
5 U.S. Bureau of Labor Statistics, “Employment Situation Summary,” news release, July 8, 2022, https://www.bls.gov/news.release/empsit.nr0.htm.

