
Diving Deeper Into Construction Spending
Divergent trends emerge when users get below the surface of topline figures for different project types.
Even data-savvy real estate investors and developers can be misled by not digging deep enough into trends for construction spending by project type. There are series tucked into the monthly government reports that provide more insight than the topline figures do.
For example, on the first of each month the U.S. Census Bureau releases an estimate of “value put in place”— spending on projects underway. The bureau’s press release lists 16 types of nonresidential projects and further breaks them out between private and public owners. That might seem like a lot of detail, but one category in particular can hide more than it reveals: private office spending, which includes spending on data centers.
Spending Categories
Following years of requests from the Associated General Contractors of America and other interested parties, on July 1 the agency began posting separate estimates for data centers at www.census.gov/constructionspending. To find the figures, it’s necessary to go to “Historical Value Put in Place” under the data tab and choose the files for private construction. Even then, some digging is required to find the non-data center piece of private office construction by subtracting data centers from the total, which includes “general” and “financial” offices separately.
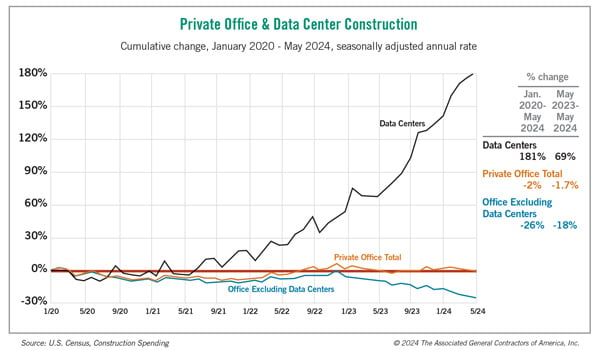
The numbers are striking. Total private office spending declined by a modest 1.7% from May 2023 to May 2024, but while spending on general and financial offices fell by a combined 18%, the data center portion soared 69%. Data center spending increased for 12 months in a row and constituted a record 33% of the private office total in May 2024 ($27 billion out of $82 billion at a seasonally adjusted annual rate).
What the Census Bureau labels “commercial” is another spending category that hides divergent trends. The historical data tables list this segment as “Commercial (inc. Farm)” and break out five subsegments, plus numerous sub-subsegments. While the overall private commercial category slumped 13% from May 2023 to May 2024, the automotive subsegment rose 11%, food/beverage declined 6%, multi-retail fell 14%, “other commercial” slid 18%, and warehouse decreased 20%.
Some subsegments also have wide differences and more hidden data. For instance, the 14% year-over-year decline in multi-retail spending includes a 13% increase in outlays on shopping centers, a 57% plunge in malls and a 69% drop in general merchandise stores. Even those subsegments don’t account for the full multi-retail total. Subtracting each from the total leaves $822 million of undisclosed spending as of May 2024, 36% less than in May 2023. The “definitions” page reveals that in addition to shopping centers, shopping malls and general merchandise stores, multi-retail “also includes warehouse-type retail stores.”
Definitions and Limitations
Careful reading of the definitions is important not just for finding unexplained project types but also for understanding what is included or excluded from the calculations of construction activity and value put in place. Notably, nonresidential and multifamily spending includes “additions, alterations, conversions, expansions, reconstruction, renovations, rehabilitations, and major replacements (such as the complete replacement of a roof or heating system).” In contrast, for owner-occupied residential properties, these types of expenditures are counted as a separate “residential improvements” segment — but are not shown in the monthly tables. More subtraction shows that the 7% year-over-year increase in private residential construction breaks down to a 14% jump in new single-family spending, a 5% drop in multifamily and a 3% rise in improvements.
Census estimates begin with a list of project starts supplied by Dodge Construction Network. For most private projects, the bureau asks the general contractor to complete a monthly report confirming that the project is active. When reports are missing or late, the bureau applies a formula based on the spend-out rate for similar projects. These estimates are later replaced with actual figures when reports come in, sometimes leading to substantial revisions. In addition, each July the bureau posts recalculated seasonal adjustment factors for the past five years of monthly data.
The various peculiarities and adjustments make it tricky to rely on the data. Nevertheless, they are the most comprehensive spending figures available. Users just need to keep the data’s limitations in mind.
Ken Simonson is the chief economist with the Associated General Contractors of America. Contact him at ken.simonson@agc.org.