Rethinking Traffic Congestion in the Pandemic’s Wake
The long-term effects on urban transportation remain unknown, but trends are emerging.
Workers have consistently specified the length and cost of commutes as reasons for their hesitancy to return to the office. According to the May 2024 Survey of Working Arrangements and Attitudes, over half of the respondents cited traveling to and from work as a key factor in their attitudes toward returning to the office. Is traffic as bad as it used to be?
A recent study from Texas A&M University shows that although congestion certainly increased from pandemic-era lows, it had not reached pre-pandemic levels throughout 2022. It confirms the profound impact of diminishing ridership on transit systems, the problematic importance of trucking and several other surprising trends.
Lessons From the Pandemic
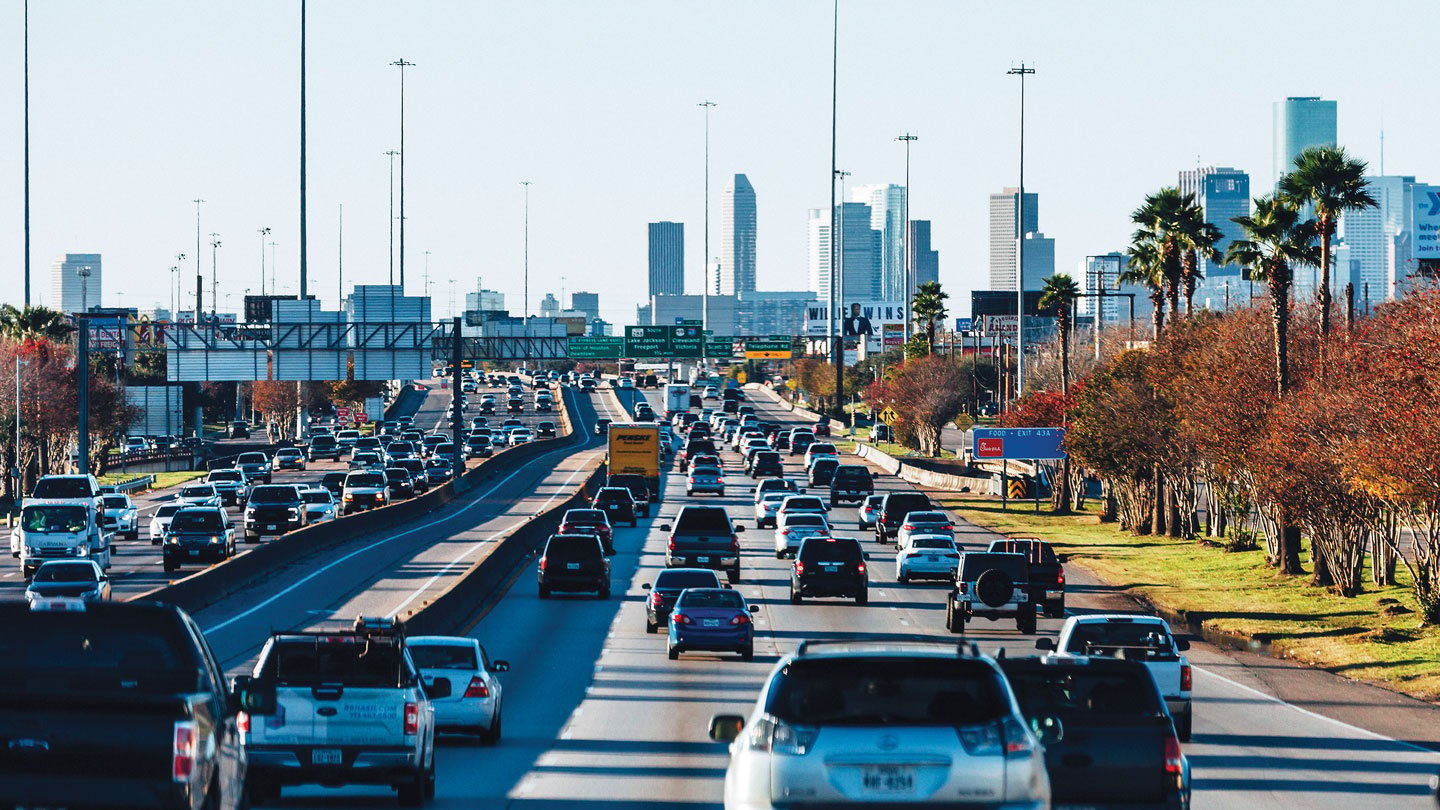
The COVID-19 pandemic created a rare instance when traffic congestion did go away briefly as businesses shut down and most nonessential personnel were working from home. This past summer, the Texas A&M University Transportation Institute released its national Urban Mobility Report, which, among other things, compares urban traffic congestion in 2019 (pre-pandemic) with data available from 2022. The report, sponsored by the Texas Department of Transportation, uses crowdsourced data from INRIX on urban streets and highways, along with highway inventory data from a Federal Highway Administration database.
The Urban Mobility Report, the most recent in a series that dates to 1987, found that overall traffic congestion numbers in the 101 metro areas studied in 2022 were still lower than in 2019, but those numbers were catching up fast. Travel patterns had changed throughout the day of the week and hour of the day.
The traditional morning and evening peak hours for commuting were still lower in 2022 than in 2019, reflecting the reduction and spreading of work trips as employers struggled to get workers to return to the office. The report cites national data which estimates that significant numbers of workers were still working from home in 2023.
These differences were sharper among the largest metro areas studied. In 2019, the average auto commuter in 26 large urban areas experienced 55 hours or more of “extra travel time” (congestion) in a year, a level classified as “extreme.” In 2020, there was only one such area. Congestion had returned by 2022, with auto commuters in 27 large urban areas once again experiencing 55 hours or more of delays. However, several metro areas with populations over 3 million experienced notable decreases in the total number of hours lost to traffic delays between 2019 and 2022:
- Washington, D.C.: -26%
- Boston: -21%
- Houston: -11%
- New York: -8%
- Chicago: -8%
These changes reflect the continued battle between employers and workers over returning to the office, as well as lagging economies.
Only five of the 101 metro areas studied experienced less than 30 hours of delay per average auto commuter in 2019. That number grew sharply to 73 in 2020 but returned to five again in 2022.
New Travel Patterns
Researchers for the Urban Mobility Report emphasized that the long-term effects of the pandemic on urban transportation are still unknown. They did note, however, that certain travel patterns emerged between 2019 and 2022.
Travel was more spread out. According to the report’s authors, “A familiar pattern of morning rush hours followed by less delay in the midday and then several hours of bad evening congestion seems to be making a comeback. However, although there is increasing resemblance between 2019 and 2022 daily congestion totals, there has been a noticeable rise in midday congestion, and weekends are now experiencing higher levels of travel compared to the pre-pandemic period.” The national-level data confirms that when people commute, they avoid Mondays and Fridays, and weekends are also bigger travel days, so travel is flattening out over the week.
Troubling trends for transit are apparent. The urban mobility study, based on highway traffic counts and speeds, does not specifically address transit, but some of the trends are worrisome nonetheless. Transit ridership in the United States declined to 20% of pre-pandemic levels in April 2020 and recovered to nearly 40% in summer 2020. By summer 2021, after the introduction of COVID-19 vaccines, ridership grew to just over 50% of pre-pandemic levels. In March 2024, ridership levels reached 79%, according to the American Public Transportation Association. In New York City, by far the dominant transit agency in the United States, the Metropolitan Transportation Authority (MTA) reported that 2023 subway ridership had returned to 68% of 2019 levels, with a higher recovery on weekends than during the week, reflecting changes in commute patterns. Bus ridership was slower to recover, reaching only 63% of the 2019 level. In contrast, MTA’s Bridges and Tunnels agency, which operates seven bridges and two tunnels linking the city's boroughs, reported record annual traffic volume in 2023.
David Schrank, senior research scientist at the Texas A&M Transportation Institute and co-author of the Urban Mobility Report, said in an interview that workers’ hesitancy to return to the office has also meant a slower than expected rebound for transit. When congestion improved, driving became more attractive for some commuters who previously relied on transit. And with the prevalence of hybrid work schedules, even dedicated transit riders returning to the office could possibly be making only one to two trips per week, Schrank said.

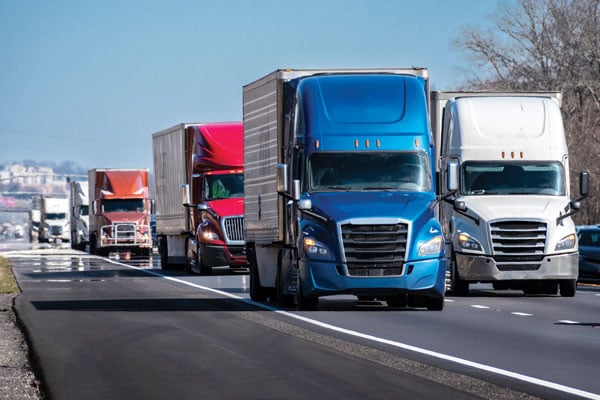
The volume of truck traffic on the roads has continued to grow in step with the rise of e-commerce. WendellandCarolyn via iStock/Getty Images Plus
Truckers kept on trucking. According to the report, truck traffic volume has continued to grow thanks to the increase in at-home delivery of goods and services. Trucking is one of the least recognized components of the nation’s transportation system by the public, but its importance to the economy continued — and even increased — during the pandemic while other traffic was waning. E-commerce surged 55% during the pandemic and has continued to grow, according to Forbes.
In 2022, the cost of truck congestion was estimated at $27.1 billion in lost time and fuel, according to the Urban Mobility Report. Truck congestion accounted for 12% of the total congestion cost in the U.S., with about 46% of this congestion cost in the largest 15 urban areas.
A New Perspective?
While travel demand post-pandemic is clearly returning and truck travel continues to grow, is it possible that a new perspective on traffic congestion will emerge?
The increased likelihood of encountering congestion during midday and weekend hours can be frustrating, and it may grow worse. Major employers are beginning to mandate return-to-office policies, and workers may be back on the roads in greater numbers.
Over the years, traffic engineers and public officials have explored diverse options for solving the vexing problem of traffic congestion. Among the proposed solutions: widening roads, optimizing the timing of traffic signals, offering more transit options to decrease people’s reliance on cars, and implementing congestion charges during peak traffic periods. Another potential answer touted by proponents is the urban planning concept of 15-minute communities, designed so that anything residents need is within a 15-minute walk or bike ride. The need to make transportation improvements will continue in growing areas, but perhaps the former push for congestion relief for commuters will partially give way to an added emphasis on the importance of trucking and goods movement.
Robert T. Dunphy is a transportation consultant and an Emeritus Fellow of the Transportation Research Board.
Pumping the BrakesSome data analytics firms have found that traffic congestion has returned or worsened from pre-pandemic levels, although their methodology and sources differ from the Texas A&M study, which is considered the most reliable and comprehensive traffic analysis. According to press accounts, StreetLight Data found that traffic congestion was down in May 2024 compared to May 2019 in only two metro areas in the nation: San Francisco (minus 0.4%) and Albuquerque (minus 0.3%). Congestion was unchanged in four metros, including Los Angeles. Everywhere else, traffic was worse off than it was before the pandemic, dominated by areas on or near the East Coast. |


