


The NAIOP CRE Sentiment Index
Release Date: April 2026
Key Findings
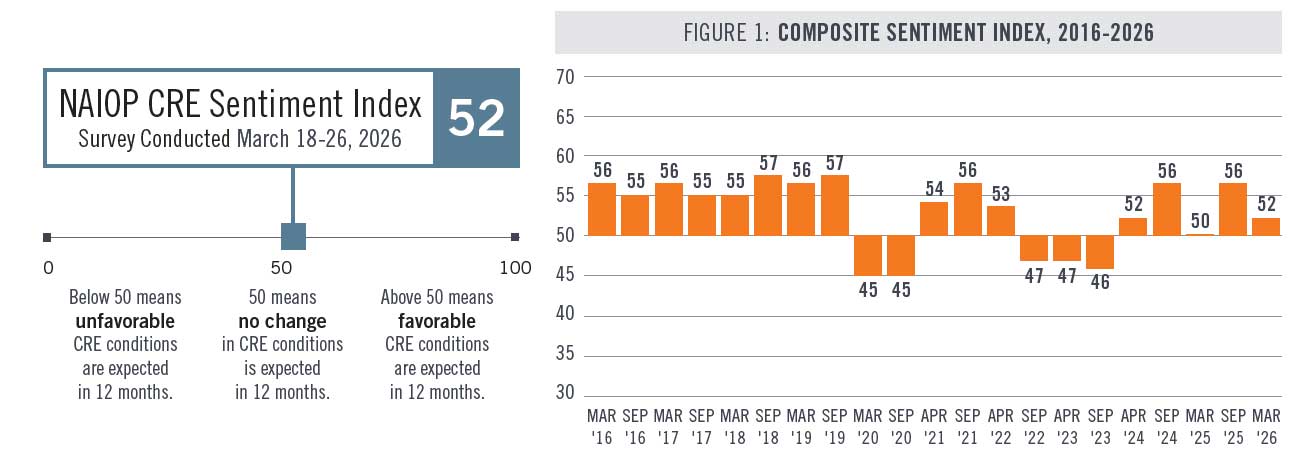
The NAIOP CRE Sentiment Index for March 2026 is 52, indicating that respondents expect slightly improving commercial real estate conditions over the next 12 months. The index declined from the September 2025 survey, suggesting respondents are less optimistic (see Figure 1).
Respondents expect capital market conditions will continue to improve but to a lesser degree. Expectations for the availability of both equity and debt, as well as for first year cap rates, remained above neutral but have eased since September.
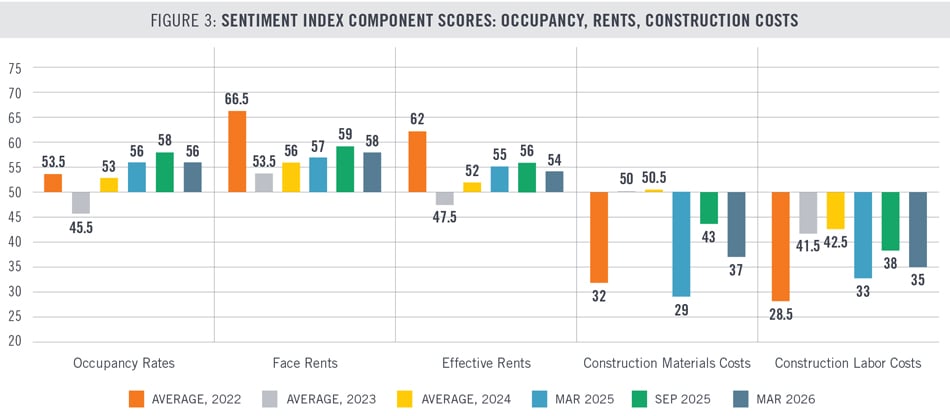
Construction costs continue to be a binding constraint on development activity. Compared with the fall survey, respondents now expect both construction material and labor costs to rise more rapidly over the next 12 months, reflecting growing concern about cost pressures.
Respondents continue to expect higher occupancy rates and growth in rents.
Developers and building owners expect an increase in the dollar volume of transactions and projects but do not anticipate meaningful increases in employment in their own firms. This combination suggests a favorable outlook for investments in stabilized buildings even though developers remain cautious due to factors such as high construction costs and plateauing interest rates. By contrast, non-developer respondents continue to expect employment growth in their own firms.
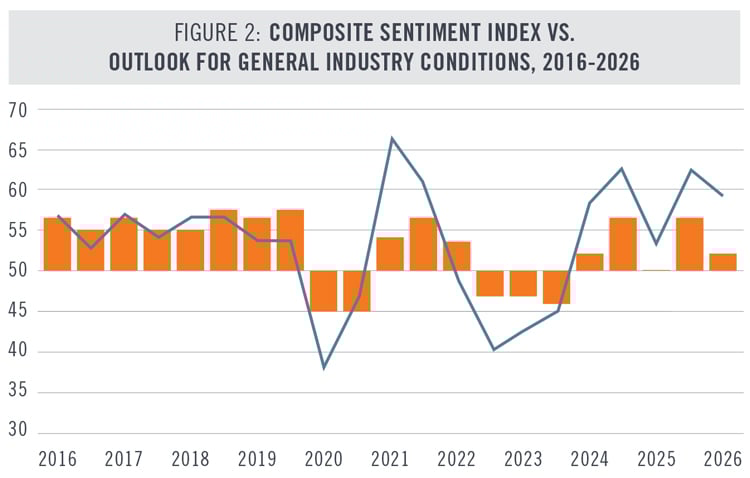
Respondents still expect general industry conditions to improve over the next 12 months, but less significantly than they thought in September. The score for general industry conditions (59) is calculated separately from the CRE Sentiment Index. A higher score than the Sentiment Index may be attributable to respondents’ outlook for factors not measured in the index, such as general economic conditions. Asked separately, developers and building owners indicated they expect favorable local economic conditions over the next 12 months.
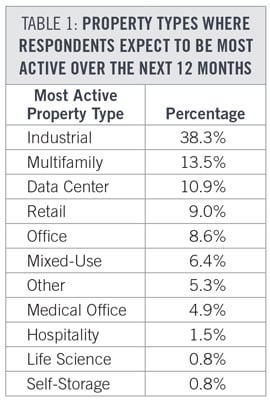
Most respondents expect to be most active in either industrial or multifamily real estate during the next 12 months (see Table 1). Data centers and retail properties attract the next highest levels of interest.
Notable Changes in the Fall 2025 Survey
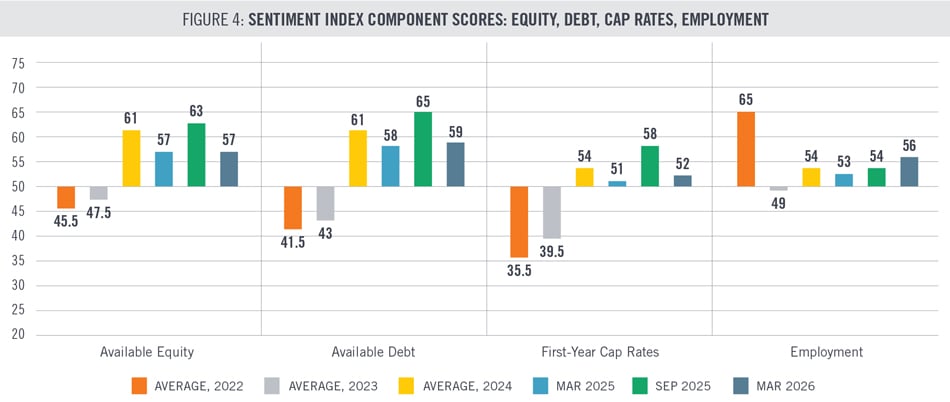
Figures 3 and 4 compare respondent expectations in March 2026 for the individual components that comprise the NAIOP CRE Sentiment Index with expectations in past surveys. For component scores from before 2022, please refer to past editions of this report. Values above 50 represent expectations that a condition will be more favorable for development over the next 12 months (for example, higher face rents, lower construction labor costs, lower cap rates). Values below 50 represent expectations that a condition will be less favorable during the next 12 months.
The largest changes in the March 2026 survey reflected a cooling outlook for capital market conditions, with respondents expecting a slower expansion in the availability of debt and equity, and a smaller decline in capitalization rates. Scores for each of these variables fell by six points but remained above 50, suggesting conditions will remain favorable. Other changes from the fall survey were relatively minor. Despite anticipating slower improvement in capital markets, developers and building owners expect to grow transaction activity at about the same pace as was expected in September (score of 60 vs. 62 in the fall).
In open ended comments from the survey, respondents expressed more concerns related to project feasibility than real estate market conditions. Several noted that elevated construction costs and approval delays are limiting the number of viable projects, while others pointed to infrastructure related constraints, such as power availability, as emerging factors directly shaping the timing and scope of projects that can be completed. Respondents also noted heightened uncertainty around federal policy, interest rates and capital market volatility as factors weighing on their near-term outlook.
Expectations for Development Conditions
The survey asks developers and building owners to evaluate how important interest rates, local economic conditions, local development approvals processes, environmental regulations and other government regulations will be to their decisions to initiate or continue development projects over the next 12 months (answers are not factored into the NAIOP CRE Sentiment Index). The survey then asks developers how favorable they expect these conditions to be. The results are described in Table 2 on a 100-point scale.
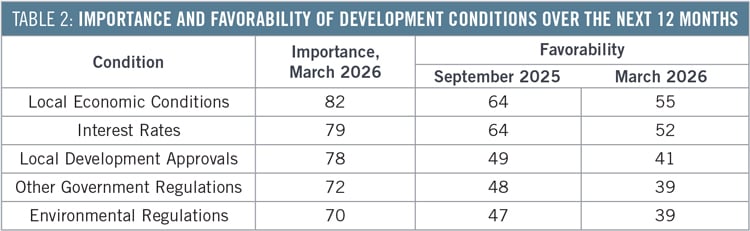
Respondents continue to rank local economic conditions and interest rates as the two most important factors influencing development decisions. However, favorability scores for both conditions declined meaningfully from September 2025. Respondents are less optimistic about the strength of local economic conditions and now expect interest rates to be only slightly favorable for development, suggesting increased caution around the broader economic and financing environment. Respondents are more pessimistic about local development approvals and other government regulations than they were in the fall survey, indicating that regulatory processes are expected to pose greater challenges to development over the next 12 months. Their outlook for environmental regulation also declined, reinforcing the view that regulatory conditions remain an obstacle to new development activity. These results suggest that respondents are less optimistic than they were six months ago about local economic conditions and interest rates, even though the relative importance of these development factors has not changed.
Differences Between Developers and Non-developers
Respondents were asked to identify their primary profession. When comparing responses from developers and building owners with those of non-developers, one statistically significant difference emerged related to the conditions that comprise the Sentiment Index. Non-developers indicated a higher likelihood that their firms would expand employment over the next 12 months than did developers and building owners. This difference is consistent with broader survey findings showing that elevated construction costs and other development related constraints continue to weigh on new project activity, while firms in brokerage, advisory and service oriented roles may remain positioned to benefit from ongoing investment and leasing activity even as development activity remains restrained.
Direct From Survey Participants
“The impact of AI on office occupancy is my biggest concern along with interest rates not coming down and construction prices continuing to go up slightly. Rent is not keeping up.”
“Construction costs have to come down, or many of these GCs that saw skyrocketing costs and massive profits over the last six-plus years will be getting a reality check. Deals still struggle to pencil.”
“Uncertainty in federal policy and the impact of uncertainty on financial markets/investor sentiment is a key detriment to our industry's performance.”
“The largest issue we continue to work through is the inconsistency of local municipalities' processes. There are no clear timeline expectations for approvals and numerous unexpected delays throughout the projects.”
“The full impact of data centers to the industry and the infrastructure will not be measurable in 12 months but will need to be measured over the next five-plus years.”
Methodology
The NAIOP CRE Sentiment Index is designed to predict general conditions in the commercial real estate industry over the next 12 months by asking industry professionals to predict conditions for their projects and markets. The NAIOP CRE Sentiment Survey is conducted biannually, in March/April and August/September. The survey is sent to roughly 10,000 NAIOP members in the U.S. who are developers, building owners, building managers, brokers, analysts, consultants, lenders and investors in commercial real estate. It asks questions about jobs, space markets, construction costs, capital markets and other conditions for real estate development. This edition of the survey also introduced two questions about the electric grid for a later NAIOP Research Foundation report.
The questions that comprise the Sentiment Index are not equally weighted. Instead, weighting varies based on whether responses to a question are tightly packed or dispersed. Questions with tightly packed responses (meaning there is more consistency among the answers to that question) are more heavily weighted than those with more dispersed responses (which indicate less consistency).
If every participant in the survey selected the most optimistic answer to every question, the index would be 100. Conversely, if all the participants chose the most pessimistic response to every question, the index would be 0. The survey includes questions that evaluate sentiment about conditions that are not included in the composite sentiment index score but are measured separately on a 100-point scale.
A cross-tabulation of the March survey results by respondent profession revealed one question in which differences between responses were statistically significant. Differences that were not statistically significant are not reported in this analysis.
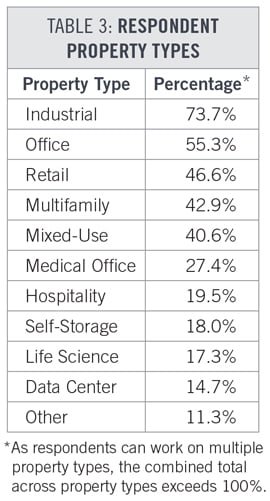
A total of 266 respondents from 237 distinct companies participated in this survey. A breakdown of the property types that respondents work on is provided in Table 3.
A regional breakdown shows that 49.6% of respondents are active in the West, 41.0% are active in the South, 32.3% are active in the East, and 29.7% are active in the Midwest. Survey participants receive a summary of results showing the percentage breakdown of responses to each question after the survey closes. This report is released to all NAIOP members and the public three to four weeks later. Survey responses for this index were gathered between March 18th and March 26th. The response rate for this survey was 2.3%, and the margin of error for the composite index score was 6%.
The statistical methodology for the Sentiment Index was originally developed by Tom Hamilton, Ph.D., MAI, CCIM, CRE, the Gerald Fogelson Distinguished Chair of Real Estate in the Chicago School of Real Estate at Roosevelt University. The survey data was collected by NAIOP, and the survey questions were created, refined and finalized between 2014 and 2023 with the assistance of several NAIOP Distinguished Fellows. NAIOP Research Analyst Max Shpilband authored the current edition of the survey and this summary analysis. For questions about the CRE Sentiment Index, please contact Max at shpilband@naiop.org.
Media Inquiries
Please contact Brielle Scott, director of marketing and communications, at scott@naiop.org.
